To recap the key monetary events of the past two years: Massive government transfer payments during the Covid era ended up being monetized and stored in bank saving and deposit accounts by a public largely unable and not very willing to spend the funds. As a consequence, the M2 money supply grew by some $6 trillion over the two-year period ending March 2022, a pace that far exceeded anything in our monetary history. All that extra cash was fine—as long as the public was willing to hold onto it. But when people emerged from their Covid cocoons in early 2021, they unleashed a tsunami of spending which overwhelmed supply chains and boosted prices for nearly everything. Inflation, as a result, surged to almost 10% by last June.
Where things stand today: The monetary fuel for the inflation fires is running out. As I’ve been reporting for most of the past year, M2 growth is slowing dramatically and inflation has most likely peaked. The Fed has been slow to react from the very beginning, unfortunately, but it is already apparent that no further rate hikes are needed.
Meanwhile, the market and the Fed are worried about the wrong thing. Yesterday Bill Dudley gave voice to these concerns when he said that “the Fed needs to restrain economic activity” in order to bring inflation down. That’s just plain wrong; inflation is not a by-product of economic activity, it is the by-product of unwanted money. Case in point: economic growth in Q3/22 and Q4/22 is quite likely to be 3-4%, up from -1% in the first half of the year, while inflation is quite likely to have declined from the 8-9% pace of the first half of the year to 4-5% in the second half. Moral: economies thrive with lower inflation and struggle with high inflation. Today’s sharply higher interest rates have strengthened the demand for money, thus mitigating the inflationary potential of what is still an elevated level of M2.
The following charts update this most important of all stories.
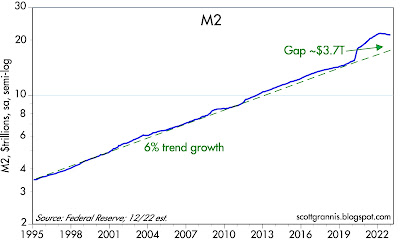
Chart #1
As Chart #1 shows, the $6 trillion M2 bulge is shrinking, both nominally and relative to the size of our growing economy. Excess money is being withdrawn, and lower inflation is the inevitable result.
Chart #2
Chart #2 shows how surging growth in the M2 money supply (blue line) was fueled by massive government deficits of equal size (roughly $6 trillion). Fortunately, over the course of the past year the money-printing press has largely shut down: ongoing deficits are no longer being monetized, and meanwhile M2 is shrinking.
Chart #3
Chart #3 compares the year over year growth of M2 (blue line) with the year over year growth in the Consumer Price Index (red line) lagged by one year, in order to show that the big surge in M2 that occurred in M2 from 2020 to 2021 explains quite well the surge in inflation that followed about one year later. The big drop in M2 growth which began a year ago is responsible for today’s lower inflation. The chart further suggests that inflation could easily drop to within range of the Fed’s 2% target later this year or by early next year.
Chart #4
Chart #4 is one of the most important charts, in my view, yet very few people are paying attention. It shows the ratio of M2 to nominal GDP, which I’ve called Money Demand. In essence, it shows how much of our annual incomes (using GDP as a proxy) we are willing to hold in the form of readily spendable cash, bank deposits, money market funds, and savings accounts (using M2 as a proxy). The ratio soared in the initial phase of the Covid era, and it has been falling ever since mid-2020. The Fed’s job this past year has thus been to keep the demand for money from collapsing, since that would result in even higher inflation, and they are doing that by raising interest rates. As the next chart shows, it’s working.
Chart #5
Chart #5 shows that only about 40% of businesses in the manufacturing sector are paying higher prices these days, according to today’s release of the ISM indices for December. This is another way of saying that inflation pressures have dropped significantly from where they were earlier this year.
The Fed has been driving monetary policy by looking in the rear-view mirror and ignoring the explosive growth in M2. That’s why they were late to react to last year’s inflation surge. They have since reacted forcefully by engineering an unprecedented surge in interest rates which has kept the demand for excess M2 from collapsing. Inflation pressures have fallen significantly, and the outlook for inflation is likely going to continue to improve, thus making further rate hikes unnecessary. If my analysis is correct, the mood of the market could improve substantially in coming months.
inflation
monetary
policy
money supply
interest rates
fed
monetary policy
money-printing
inflationary