Economics
The Ecological Monetarism QED
Reader Econned asks me for a critique of ecological monetarism. I don’t have one overall assessment, but I will say that I do not understand (1) how…

Reader Econned asks me for a critique of ecological monetarism. I don’t have one overall assessment, but I will say that I do not understand (1) how Cameron Harwick came up with the conclusion that the case for ecological monetarism was proven by inflation outcomes, and relatedly (2) how the below graph was constructed, which I believe is the basis for that conclusion.
Here is Harwick’s graph.
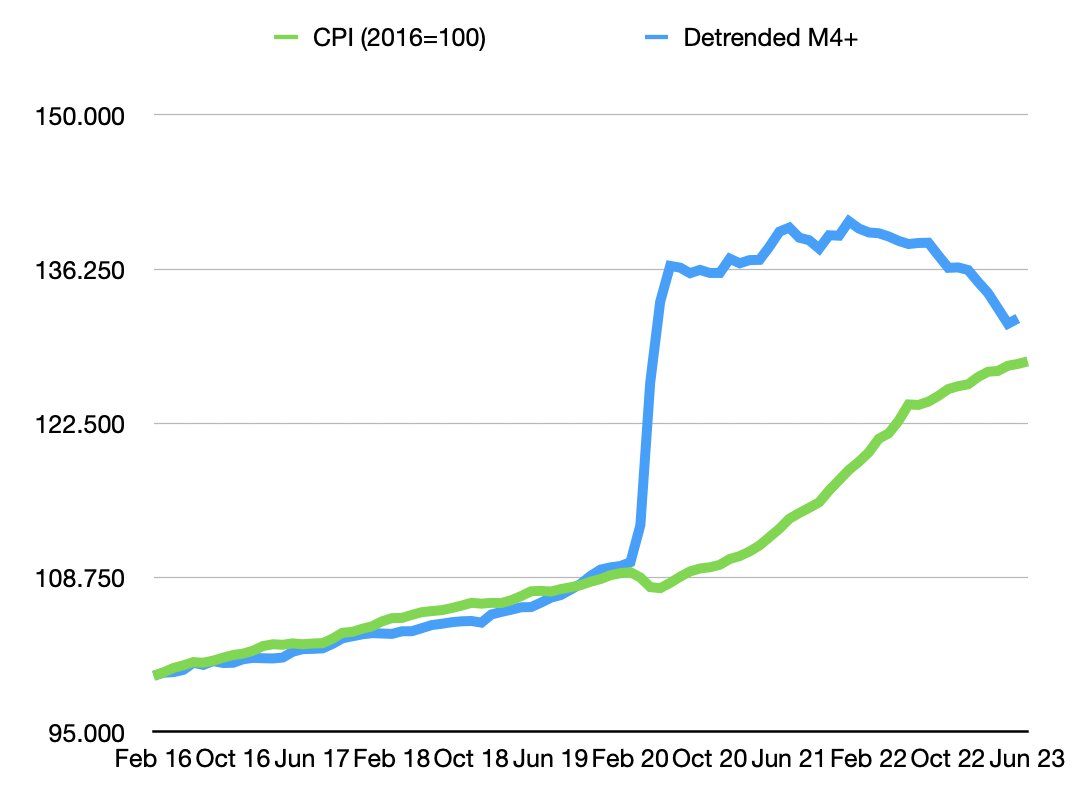
Source: C. Harwick (2023).
Certainly, the graph seems to indicate the actual price level and money (detrended) match up pretty closely by June 2023.
Unfortunately, the article doesn’t say how M4+ is detrended. It was clearly not a Hodrick-Prescott filter that was used (I tried that).
I detrended by dividing by GDP, which is consistent with some versions of the Quantity Theory. This yields the analogous picture (in logs):
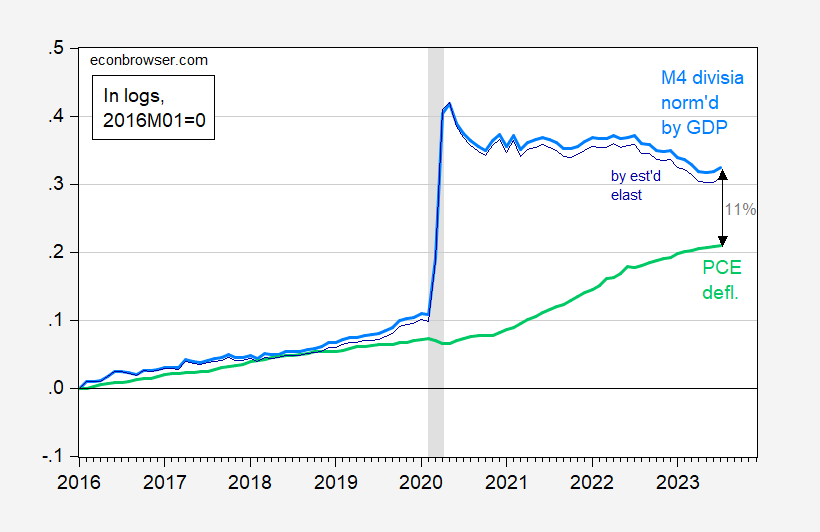
Figure 1: PCE price deflator (light green), M4 divisia divided by real GDP (light blue), m4 divisia divided by GDP to the 1.1 power (dark blue), all in logs, 2016M01=0. NBER defined peak-to-trough recession dates shaded gray. Source: BEA, Cleveland Fed, SPGMI, CFS, NBER, and author’s calculations.
[Observations for 2023M07 for PCE deflator is the Cleveland Fed nowcast as of 8/29; for GDP is forecasted using lagged GDP and current NFP.]
The gap between the price level measured using the PCE deflator and normalized divisia M4 is 11% as of July. One might argue that detrending by GDP is inappropriate; maybe it’s better to use the income elasticity of real money demand, estimated from a money demand equation. Using Johansen over the 1967-2019 period yields an elasticity of about 1.1. Using this estimate leads to a gap of 10% (and widening!).
As an aside, if we were living in a flex-price monetarist world, the price level should’ve jumped at the same time divisia money increased, by about 30%. Obviously, that didn’t happen.
In the end, in order to differentiate between models, one could have to compare predictive power (e.g., here). I haven’t done that comparison recently, but I have estimated how an expectations and supply shock augmented Phillips curve does. If one thinks about how inflation has come down recently in line with measured cost-push shocks (e.g., the NY Fed GSCPI), then one might say the Phillips curve makes more sense than the quantity theory.


Argentina Is One of the Most Regulated Countries in the World
In the coming days and weeks, we can expect further, far‐reaching reform proposals that will go through the Argentine congress.

Crypto, Crude, & Crap Stocks Rally As Yield Curve Steepens, Rate-Cut Hopes Soar
Crypto, Crude, & Crap Stocks Rally As Yield Curve Steepens, Rate-Cut Hopes Soar
A weird week of macro data – strong jobless claims but…

Fed Pivot: A Blend of Confidence and Folly
Fed Pivot: Charting a New Course in Economic Strategy Dec 22, 2023 Introduction In the dynamic world of economics, the Federal Reserve, the central bank…
