Economics
Stagflation Is Here: What Can Investors Expect?
The PCE rises (although far from the 8% peak). The GDP falls (is contraction of the economy over? Meanwhile, stagflation persists along with the trading…

The PCE rises (although far from the 8% peak).
The GDP falls (is contraction of the economy over?
Meanwhile, stagflation persists along with the trading ranges in indices and many sectors.
Plus, the theory we have been expounding on (a 2-year business cycle within a longer 6–8-year business cycle) gets more relevant every week.
How long can this trading range continue for?
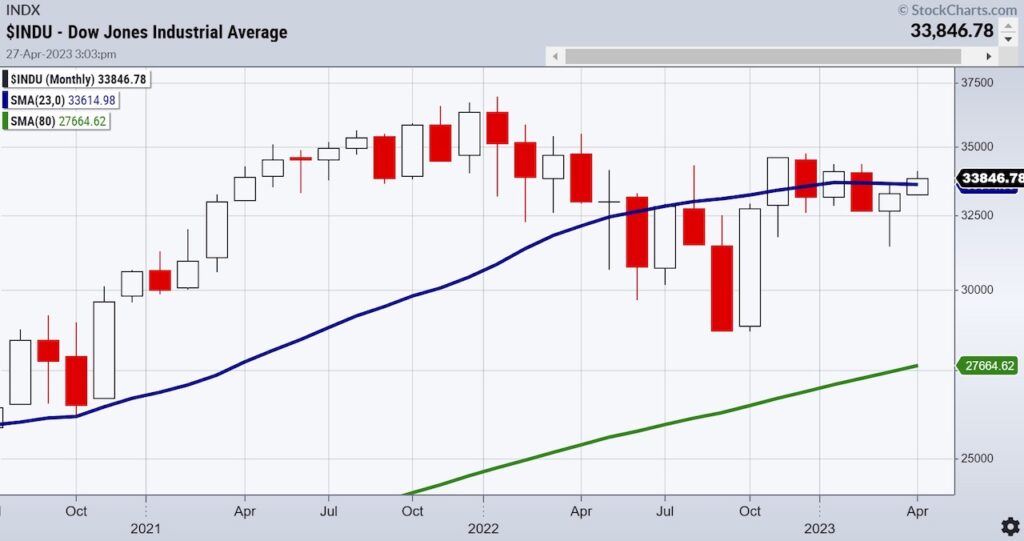
Looking at the Dow Jones Industrial Average, the range has been from $31,4239.82 to $34,342.32 in 2023.
Historically, we have seen the Dow remain rangebound for years (1968-1982).
In current times though, things move much faster.
The 23-month moving average is a shorter-term cycle within a longer-term cycle.
The DJIA is sitting right on the monthly MA-teasing investors during a tough time making a prediction of the next major moves.
With April about over, it will be fascinating to see if the DJIA closes above or below the blue line or 33,600.
It could be that the economy has contracted enough for now and will grow marginally.
It could also be that inflation peaked at 8% but could still have more upside.
There are many factors to consider such as geopolitics.
For now, we are accepting that stagflation remains the theme.
If so, we are looking at sectors outperforming the 2-year cycle showing expansion.
Interestingly, some growth stocks (META APPL MSFT), defense sectors (Raytheon RTX), consumer staples (PG, Walmart), global streaming stocks (FWONA) and as few commodities (GLD, SLV, Sugar) fit that bill.
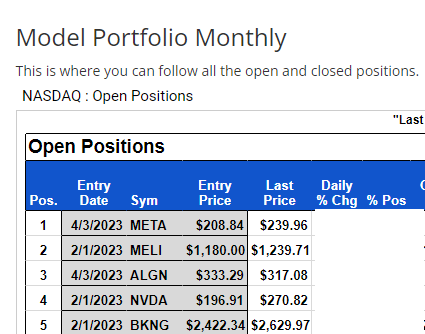
Our NASDAQ All-Stars model has picked up on these growth stocks.
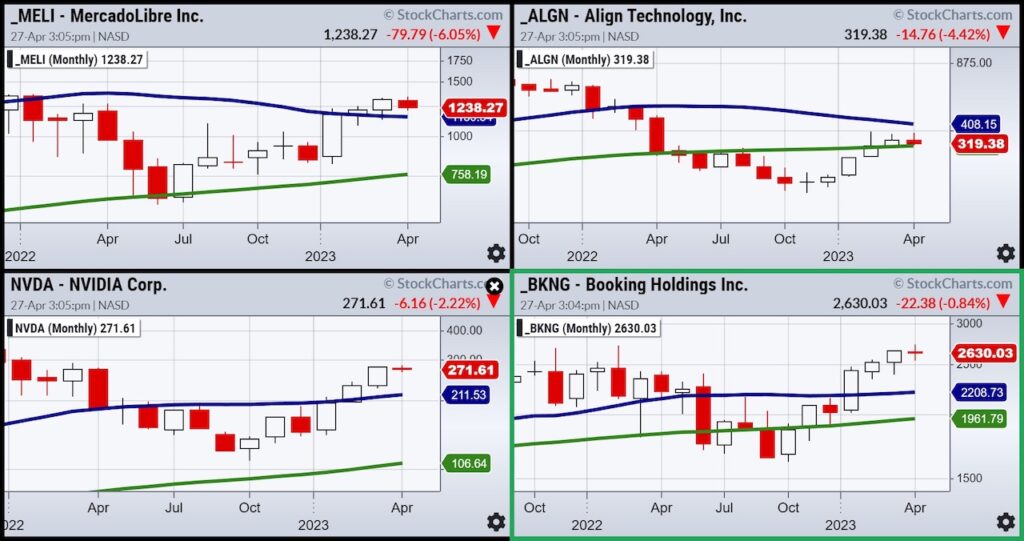
Now that META has wowed (and handily cleared the 23-month moving average), perhaps we will see the others join in as they get ready to report.
Here are the other positions relative to the 23-month MA.
Stock Market ETFs Trading Analysis & Summary:
S&P 500 (SPY) 23-month MA 420
Russell 2000 (IWM) 170 support – 180 resistance
Dow (DIA) Over the 23-month MA
Nasdaq (QQQ) 329 the 23-month MA
Regional banks (KRE) 43 now pivotal resistance
Semiconductors (SMH) 246 the 23-month MA
Transportation (IYT) 202-240 biggest range to watch
Biotechnology (IBB) 121-135 range to watch from monthly charts
Retail (XRT) 56-75 trading range to break one way or another
Twitter: @marketminute
The author may have a position in mentioned securities at the time of publication. Any opinions expressed herein are solely those of the author and do not represent the views or opinions of any other person or entity.
The post Stagflation Is Here: What Can Investors Expect? appeared first on See It Market.


Argentina Is One of the Most Regulated Countries in the World
In the coming days and weeks, we can expect further, far‐reaching reform proposals that will go through the Argentine congress.

Crypto, Crude, & Crap Stocks Rally As Yield Curve Steepens, Rate-Cut Hopes Soar
Crypto, Crude, & Crap Stocks Rally As Yield Curve Steepens, Rate-Cut Hopes Soar
A weird week of macro data – strong jobless claims but…

Fed Pivot: A Blend of Confidence and Folly
Fed Pivot: Charting a New Course in Economic Strategy Dec 22, 2023 Introduction In the dynamic world of economics, the Federal Reserve, the central bank…


