Economics
S&P 500 Risk Profile: 19 October 2022
The US stock market’s bounce in recent days has inspired speculation in some quarters that equities have found a bottom. Maybe, but the strength of downside…

The US stock market’s bounce in recent days has inspired speculation in some quarters that equities have found a bottom. Maybe, but the strength of downside momentum and other factors suggest otherwise.
To be fair, forecasting near-term changes in financial markets is like trying to grab fish in a barrel. It’s possible, but few if any can reliably play this game. Nonetheless, it’s useful to run some analytics and think through the implications for perspective with managing expectations. On that basis, profiling the S&P 500 from several perspectives still suggests the net risks skew to the downside.
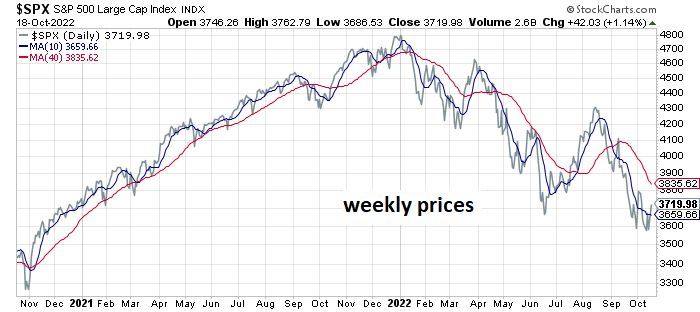
Let’s start with the broad trend for the S&P through yesterday’s close (Oct. 18). As the chart below highlights, a negative bias remains intact. Although the market has rebounded a bit, it’s not yet obvious that this is anything more than one more short-term rally in an otherwise sliding trend. When the S&P no longer posts lower lows and lower highs the case for turning bullish will be stronger. But at the moment that turning point still appears to be a date at some point in the future.
Another reason to stay cautious on the market’s outlook comes by way of a pair US equity ETFs that can be used as a proxy for estimating the trend in the market’s risk-on/risk-off sentiment evolution. Back in August I was wondering if the bounce in this ratio was an early signal that a recovery for risk-on was brewing. That was a tentative idea two months ago and the prospect has since faded as this ratio has resumed its downward trend.

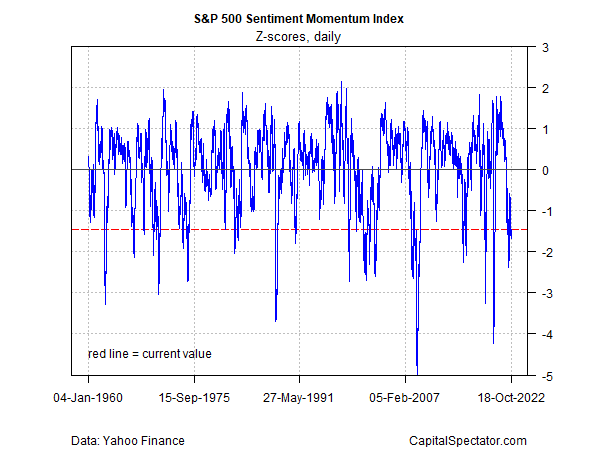
Another view of the market reaffirms that sentiment remains solidly bearish, based on CapitalSpectator.com’s S&P 500 Sentiment Momentum Index (for design details see this summary). This indicator can be used on a contrarian basis – deeply negative readings imply the market will rebound, at least temporarily. But for strategic-minded investors the current reading continues to suggest caution.
Meanwhile, the current S&P 500 drawdown – in excess of -24% — reminds that the market selloff this year is unusually steep. This may be a sign that a contrarian trade is warranted, but be aware that drawdown’s value as a timing indicator for short-term trading is highly suspect.

Meanwhile, a methodology for quantitatively estimating bear-market conditions continues to reflect a pessimistic profile in the extreme, based on the Hidden Markov model (HMM). This indicator first hinted at a bear-market signal by rising above the 50% probability mark in early May. The latest reading of 99.9% (Oct. 19) shows no letup in bearish conditions. (For some background on how the analytics are calculated in the chart below, see this primer.)

Turning to bubble risk for the S&P 500, estimating this state of affairs reflects a warning signal, suggesting that it’s still too early to go bottom fishing. (See this 2014 post for some background on the methodology).

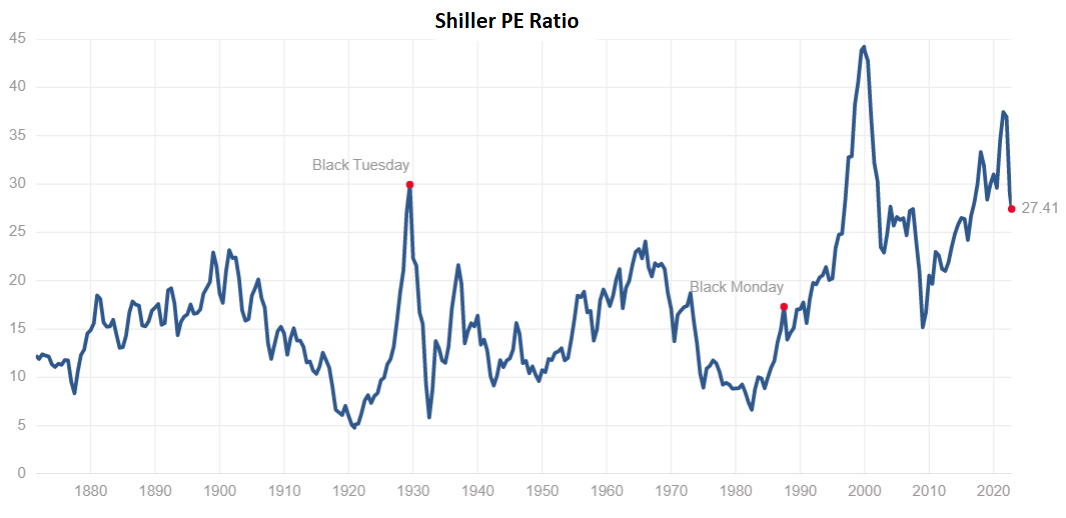
Finally, market valuation continues to pull back from the recent peak, based on the Professor Robert Shiller’s Cyclically Adjusted PE Ratio (CAPE Ratio), a.k.a Shiller PE Ratio. Nonetheless, no one will confuse the current valuation as an indication of inexpensive pricing. That alone doesn’t preclude a market rally. But for investors looking for a bargain, the market looks priced at a middling level at best compared with recent history.
Learn To Use R For Portfolio Analysis
Quantitative Investment Portfolio Analytics In R:
An Introduction To R For Modeling Portfolio Risk and Return
By James Picerno


Argentina Is One of the Most Regulated Countries in the World
In the coming days and weeks, we can expect further, far‐reaching reform proposals that will go through the Argentine congress.

Crypto, Crude, & Crap Stocks Rally As Yield Curve Steepens, Rate-Cut Hopes Soar
Crypto, Crude, & Crap Stocks Rally As Yield Curve Steepens, Rate-Cut Hopes Soar
A weird week of macro data – strong jobless claims but…

Fed Pivot: A Blend of Confidence and Folly
Fed Pivot: Charting a New Course in Economic Strategy Dec 22, 2023 Introduction In the dynamic world of economics, the Federal Reserve, the central bank…
