As the end of April approaches, will 2023 be another year where the “Sell In May” strategy works? While no one knows the answer, historical statistics,…
As the end of April approaches, will 2023 be another year where the “Sell In May” strategy works? While no one knows the answer, historical statistics, current economic indicators, and technical measures suggest some caution is warranted….
This is an edited and abridged version of the original article to provide you with a fast and easy read.
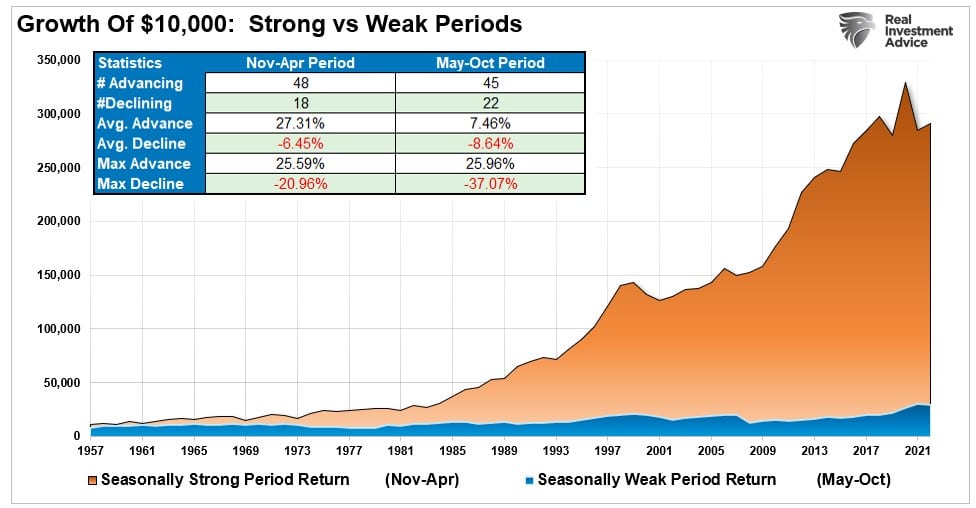
An old adage says investors should “Sell May And Go Away” and historical analysis prove this as $10,000 invested in the market from November to April vastly outperformed that amount invested from May through October.
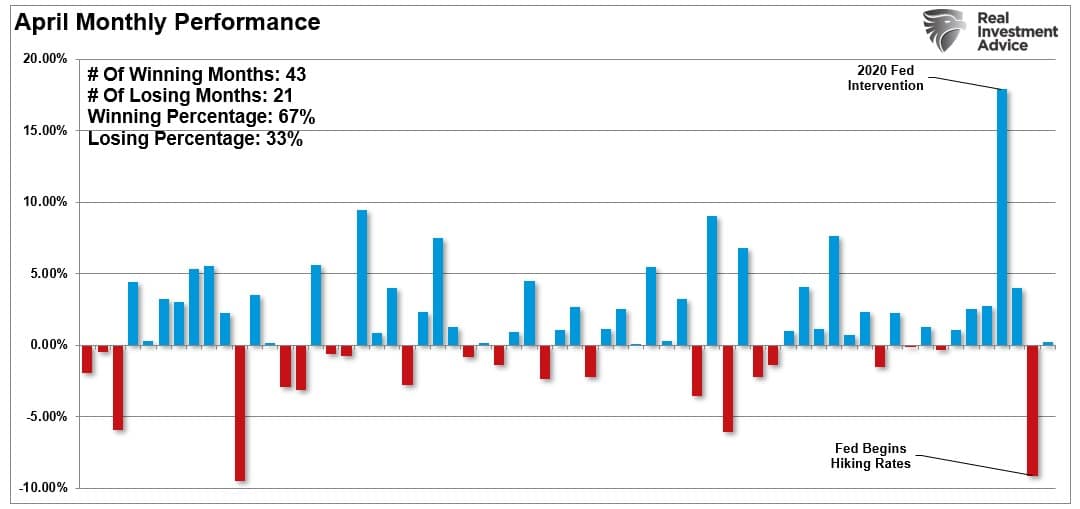
…Not every summer works out poorly, however. Historically, there are many periods where “Sell In May” did not work and markets rose. 2020 and 2021 were examples where massive Federal Reserve interventions pushed prices higher in April and subsequent summer months. However, 2022 was the opposite as April declined sharply as the Fed began an aggressive interest rate hiking campaign the preceding month.
As the end of April approaches, will 2023 be another year where the “Sell In May” strategy works? While no one knows the answer, historical statistics, current economic indicators, and technical measures suggest some caution is warranted….
Indicators Suggest Caution
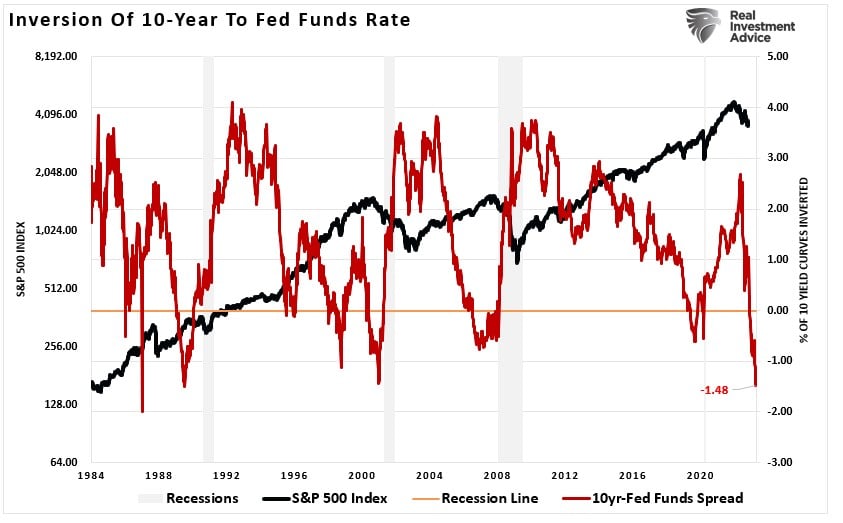
In the latestBull Bear Report, I discussed that many indicators are undoubtedly concerning and suggest an “official” economic recession is likely. The inversion of the Fed Funds rate to the 10-year Treasury is the most inverted since 1986 (roughly 10-months before the 1987 market crash.)
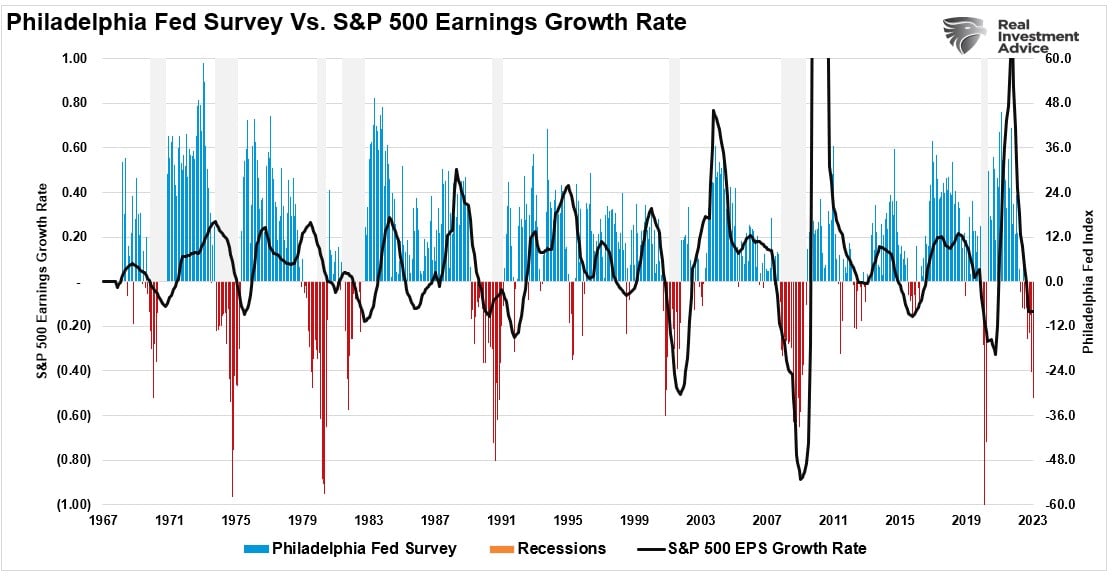
Furthermore, the most recent release of the Philadelphia Federal Reserve Manufacturing Index showed a sharp plunge in sentiment, suggesting a more pronounced correction than earnings currently represent. Historically, such deep readings of the “Philly Fed” index were associated with harder, not softer, economic recessions.
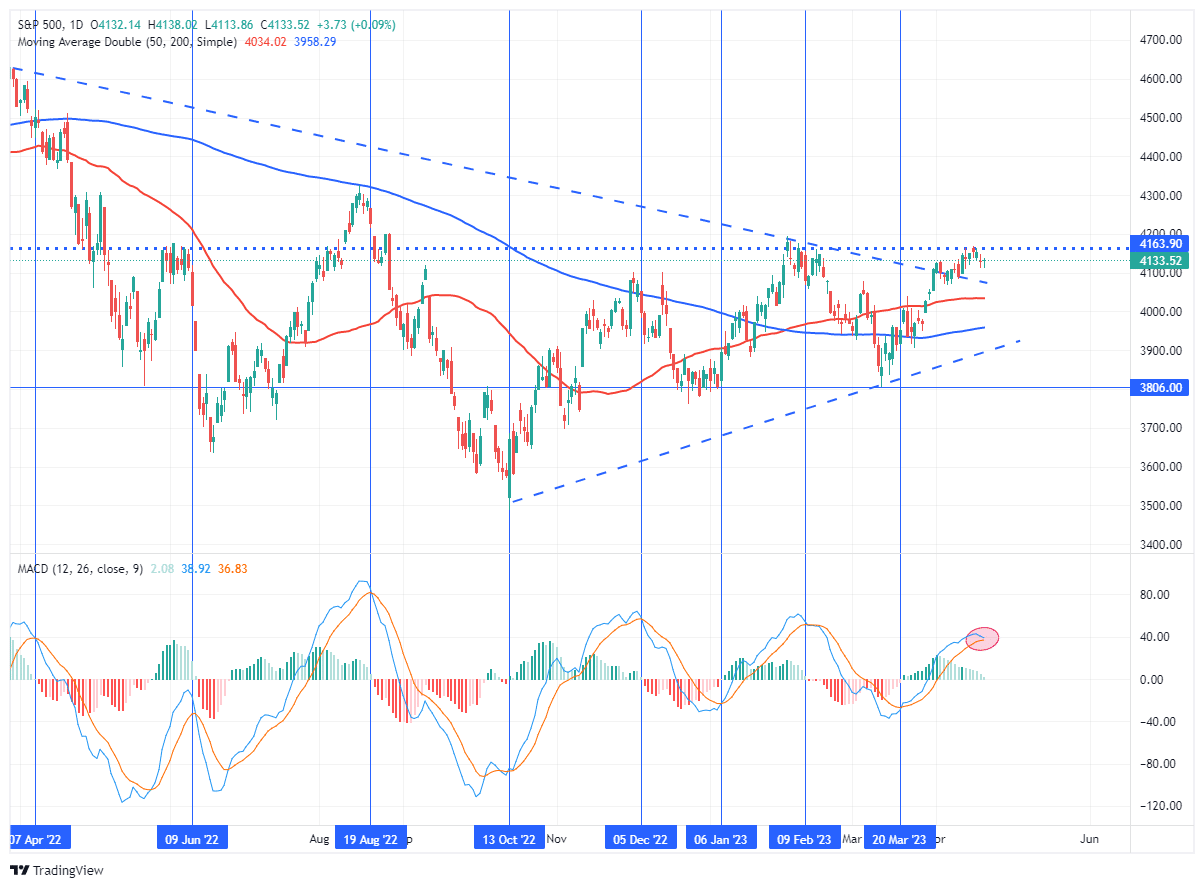
However, in the short term, it is the technical price action that we pay the closest attention to. Such is because the price action represents the psychology of the market. Those technical indicators were the primary drivers behind reducing exposure to the markets in February and increasing again in March. The vertical lines represent each “buy” and “sell” signal over the last year.
While these signals are not timing indicators to “be all in or out” of the market, they have consistently provided good signals to increase and reduce exposure to equity risk accordingly. Those indicators suggest that investors may be well served to “Sell May” and return later.
The Fed Set To Hike Rates
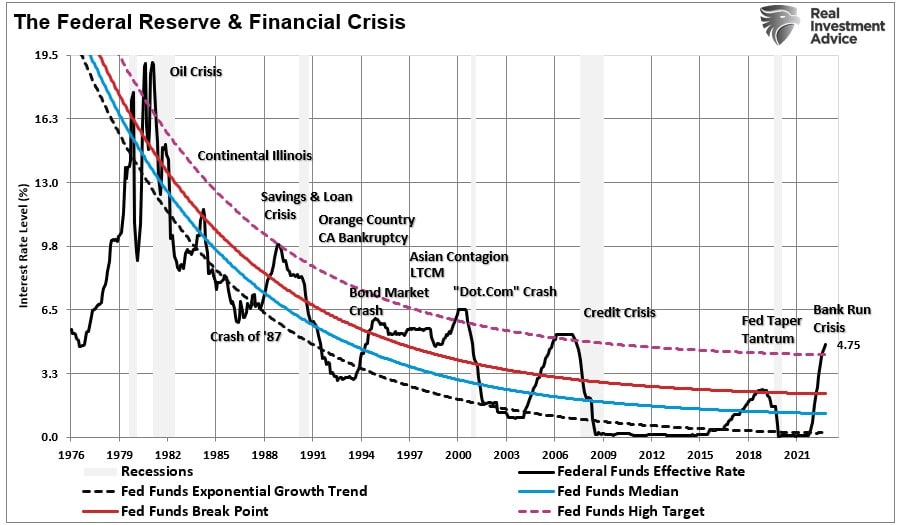
While the technical indications may be enough warning on their own to reduce risk heading into May, it is worth remembering the Fed is set to hike rates again on the 5th. With each rate hike, we are getting closer to the Federal Reserve breaking something economically or financially. Such has repeatedly been the case throughout history and given the aggressiveness of the rate hiking campaign over the last year, a negative outcome would be unsurprising.
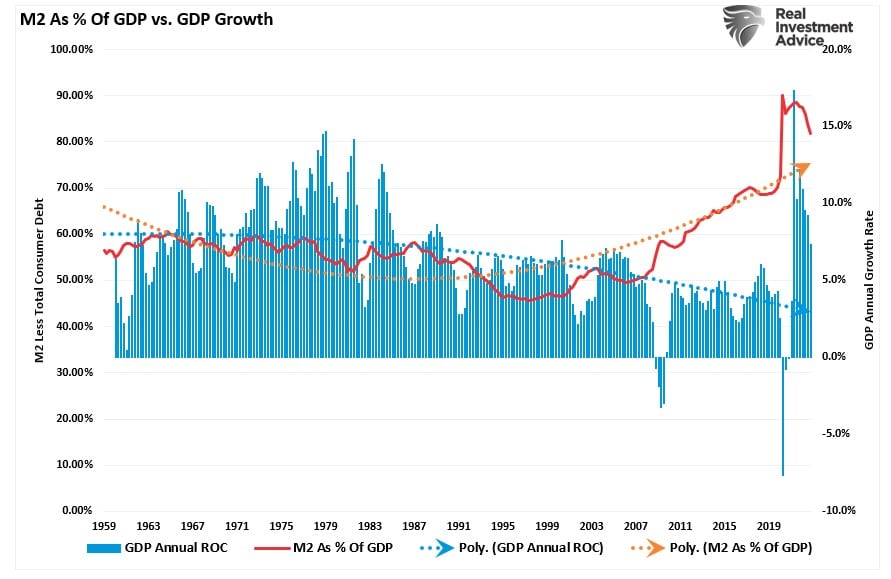
So far, the markets have weathered the rate increase much better than expected. However, most of those rate hikes have yet to work through the economic system. Furthermore, the economy has remained buoyed by the massive increase in money supply, which still supports economic activity but that support is also fading as the last vestiges of pandemic support programs end.
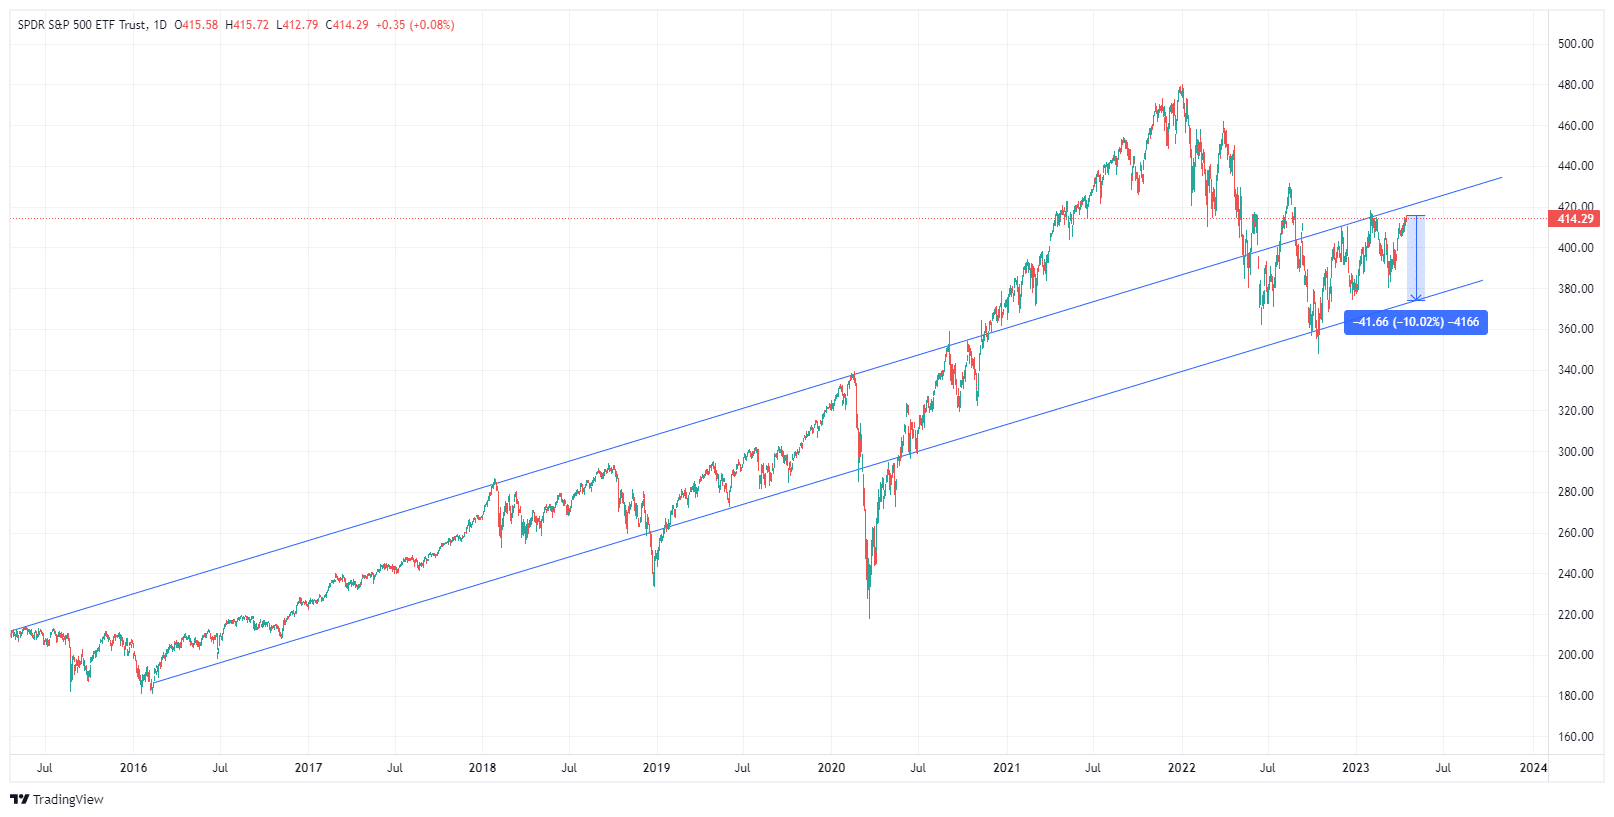
As we enter the traditionally weak summer months, we must note that the market’s bullish trend remains intact. However, as I concluded this past weekend:
“A correction should be acknowledged and expected. A 10% decline would lead to another retracement to the lows of the bullish trend channel, as noted above. If that support holds, that would be a logical place to add exposure to risk assets from a purely technical perspective.”
…If that support holds, that would be a logical place to add exposure to risk assets from a purely technical perspective…Could we be wrong to “sell May” and go away until later? It is certainly possible, and if such is indeed the case, we will add exposure accordingly when needed, however, being cautious heading into the summer may pay extra dividends.
The seasonal effect is very real and has been written about extensively in popular media (and to a lesser extent in academia), but relatively little has been written examining what may be the etiological factors behind this phenomenon. So this article attempts to briefly address the question: what are the causes of this phenomenon?
The inner trader in me is constantly worried and constantly thinking I should be trading Mr. Market’s schizophrenic mood swings. The “sell in May and go away” thesis has shown itself quite rigorous and valid over 50+ years, so it is hard to ignore but you really must analyze it further than 6 months risk-on (November through April), 6 months risk-off (May through October) like the stock traders’ almanac implies. Instead, you should break it down month by month to get a more detailed picture of how you should be trading, if you are a market timer.
There is a belief among many investors that excess returns can be earned in the market by owning stocks for only 6 months out of the year and sitting the rest of the time in interest-bearing Treasury securities. This market-timing strategy is commonly known as Sell in May and Go Away because the exit period is May. CXO Advisory took a look at “Sell in May” over the long-term to determine if this belief was fact or fiction.
Some market participants may be looking to heed the advice of the old market proverb “Sell in May and Go Away”. The question this article seeks to answer is whether this calendar effect is spurious, or whether this is something readers should heed.
The saying “sell in May and go away” infers that the stock market is seasonally weak from May to September and, as such, one should not own stocks during that period of time. As illustrated in the chart below, however, the stock market is not particularly bearish then. It is merely less bullish (i.e. the odds of the market going down vs. up are equivalent). That’s why “sell in May and go away” is not a good trading strategy. Let me illustrate that fact further in the 10 charts below.
The “sell in May and go away”, which] implies that the market’s performance is far worse in the six summer months than in the six winter months is the case with respect to US stock markets but what is the status in other countries? I have examined the patterns in the eleven most important stock markets in the world and found that it does, indeed, make sense to “sell in May and go away” in 9 of the 11 countries. In which two countries has it not been the case – at least until now? Read on for the answers.
One of the most enduring of Wall Street axioms – falling somewhere under “buy low and sell high” but above “greed is good” – is to “sell in May and go away” and, indeed, there appeared to be some truth to the saying. Between 1950 and 2012, the Dow Jones gained an average of 7.6% annually during the November-April period, but only 0.4% during May-October. Does “Sell In May and Go Away” still hold true as a viable investment strategy? Not according to my analysis. Here’s why.
Fed Pivot: Charting a New Course in Economic Strategy Dec 22, 2023 Introduction In the dynamic world of economics, the Federal Reserve, the central bank…
We use cookies on our website to give you the most relevant experience by remembering your preferences and repeat visits. By clicking “Accept”, you consent to the use of ALL the cookies.
This website uses cookies to improve your experience while you navigate through the website. Out of these, the cookies that are categorized as necessary are stored on your browser as they are essential for the working of basic functionalities of the website. We also use third-party cookies that help us analyze and understand how you use this website. These cookies will be stored in your browser only with your consent. You also have the option to opt-out of these cookies. But opting out of some of these cookies may affect your browsing experience.
Necessary cookies are absolutely essential for the website to function properly. These cookies ensure basic functionalities and security features of the website, anonymously.
Cookie
Duration
Description
cookielawinfo-checbox-analytics
11 months
This cookie is set by GDPR Cookie Consent plugin. The cookie is used to store the user consent for the cookies in the category "Analytics".
cookielawinfo-checbox-functional
11 months
The cookie is set by GDPR cookie consent to record the user consent for the cookies in the category "Functional".
cookielawinfo-checbox-others
11 months
This cookie is set by GDPR Cookie Consent plugin. The cookie is used to store the user consent for the cookies in the category "Other.
cookielawinfo-checkbox-necessary
11 months
This cookie is set by GDPR Cookie Consent plugin. The cookies is used to store the user consent for the cookies in the category "Necessary".
cookielawinfo-checkbox-performance
11 months
This cookie is set by GDPR Cookie Consent plugin. The cookie is used to store the user consent for the cookies in the category "Performance".
viewed_cookie_policy
11 months
The cookie is set by the GDPR Cookie Consent plugin and is used to store whether or not user has consented to the use of cookies. It does not store any personal data.
Functional cookies help to perform certain functionalities like sharing the content of the website on social media platforms, collect feedbacks, and other third-party features.
Performance cookies are used to understand and analyze the key performance indexes of the website which helps in delivering a better user experience for the visitors.
Analytical cookies are used to understand how visitors interact with the website. These cookies help provide information on metrics the number of visitors, bounce rate, traffic source, etc.
Advertisement cookies are used to provide visitors with relevant ads and marketing campaigns. These cookies track visitors across websites and collect information to provide customized ads.