Economics
r vs. g
Olivier Blanchard and Larry Summers had an interesting exchange about interest rates and secular stagnation, and target inflation rates today, at PIIE….
Olivier Blanchard and Larry Summers had an interesting exchange about interest rates and secular stagnation, and target inflation rates today, at PIIE. Blanchard mentioned the evolution of r vs. g as a key issue in thinking about secular stagnation, and this spurred me to look at the data.
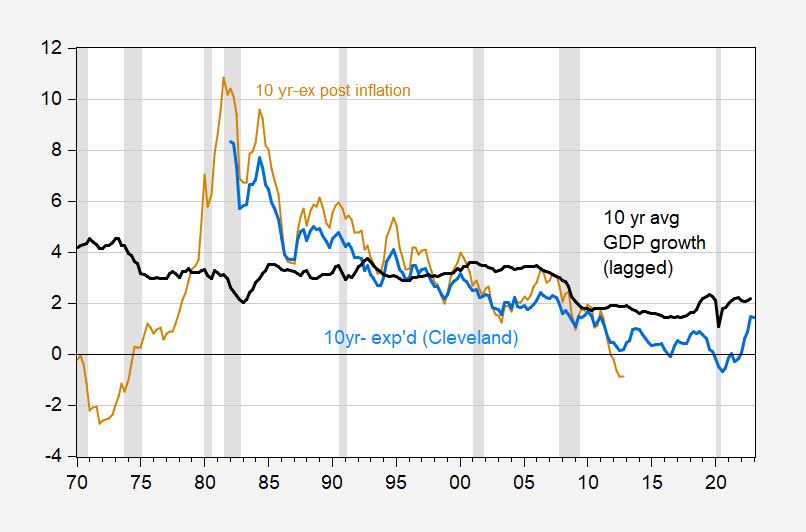
First, real 10 year Treasury rates adjusting for expected inflation, vs. 10 year growth rates over the previous ten years.

FIgure 1: Ten year Treasury yield adjusted by ex post inflation (tan), by Cleveland Fed expected inflation (blue), and average growth rate of GDP over the previous ten years (black). NBER defined peak-to-trough recession dates shaded gray. Source: Treasury via FRED, Cleveland Fed, BEA, NBER, and author’s calculations.
In fact, one might be better thinking of the real interest rate vs. the growth rate over the relevant period. We could calculate and use the ex post growth rate of GDP (ending with the observation in 2012Q4), but instead I use CBO’s estimate of potential growth.
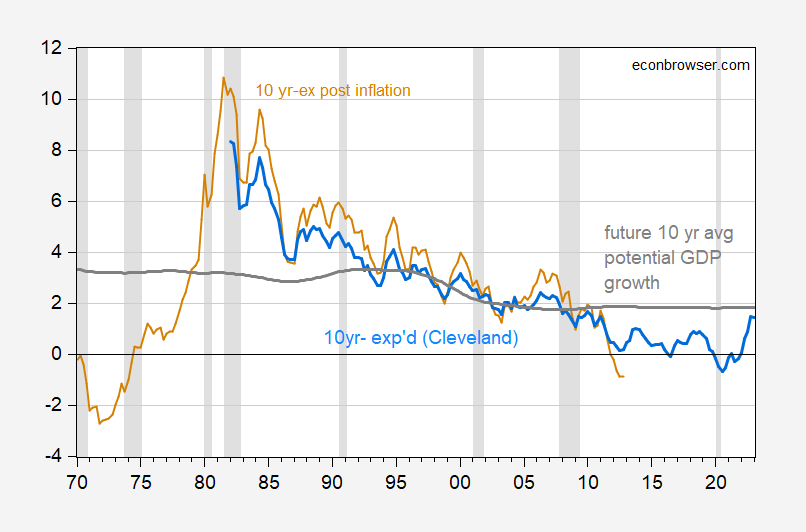
FIgure 2: Ten year Treasury yield adjusted by ex post inflation (tan), by Cleveland Fed expected inflation (blue), and average growth rate of potential GDP over the next ten years (gray). NBER defined peak-to-trough recession dates shaded gray. Source: Treasury via FRED, Cleveland Fed, CBO, NBER, and author’s calculations.
g > r for the past decade, including 2020-21. Right now the two have converged, but given the evolution of these two rates over the recent past, we can see why the debt to GDP ratio has not exploded, post-Trump, despite large (in dollar terms) deficits.
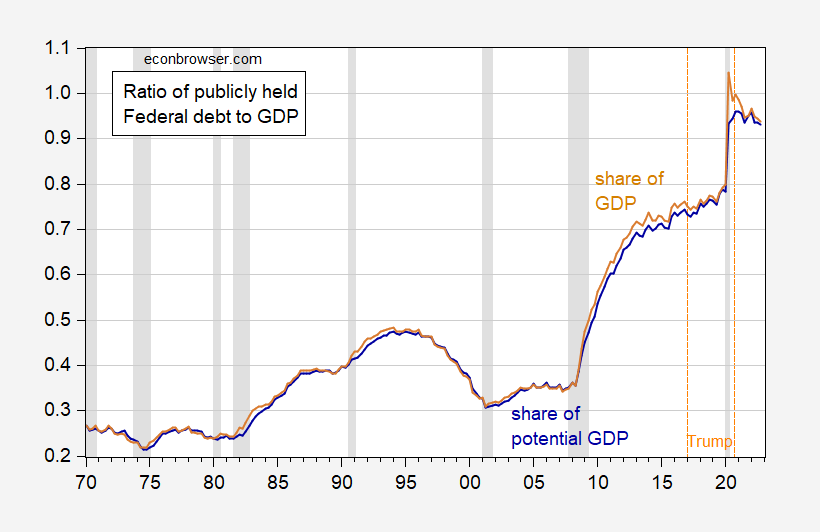
FIgure 3: Federal debt held by public as a share of GDP (tan), as share of potential GDP (dark blue). NBER defined peak-to-trough recession dates shaded gray. Source: Treasury, BEA via FRED, CBO, NBER, and author’s calculations.
To recap, Debt-to-GDP dynamics are described by this expression.
(1) dt-dt-1 = [(rt-gt)/(1+gt)]× dt-1 – pt
Where d is the debt to GDP ratio, r is the real (inflation adjusted) interest rate, g is the growth rate of real GDP, and p is the primary (noninterest) surplus to GDP ratio. In words, the debt to GDP ratio rises when the real interest rate-growth rate gap is sufficiently positive, or the primary deficit is sufficiently large.
Note that different measures of expected inflation yield similar measures of the real 10 year rate as of the first two months of 2023Q1.
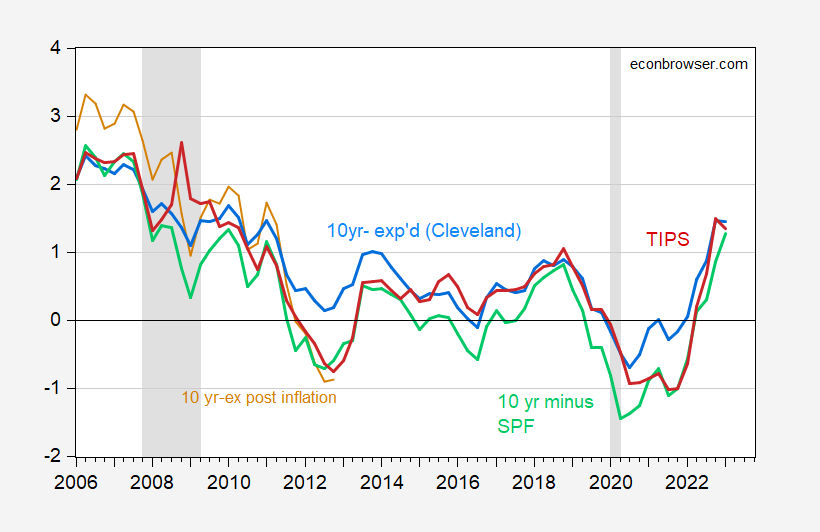
FIgure 4: Ten year Treasury yield adjusted by ex post inflation over subsequent ten years (tan), by Cleveland Fed expected ten year inflation (blue), by SPF median expected ten year inflation (green), and TIPS ten year yield (red). NBER defined peak-to-trough recession dates shaded gray. 2023Q1 observation is for first two months. Source: Treasury via FRED, Cleveland Fed, BEA, NBER, and author’s calculations.
Clearly if real rates further rise, or growth prospects diminish, then the debt dynamics do not work to our advantage.


Argentina Is One of the Most Regulated Countries in the World
In the coming days and weeks, we can expect further, far‐reaching reform proposals that will go through the Argentine congress.

Crypto, Crude, & Crap Stocks Rally As Yield Curve Steepens, Rate-Cut Hopes Soar
Crypto, Crude, & Crap Stocks Rally As Yield Curve Steepens, Rate-Cut Hopes Soar
A weird week of macro data – strong jobless claims but…

Fed Pivot: A Blend of Confidence and Folly
Fed Pivot: Charting a New Course in Economic Strategy Dec 22, 2023 Introduction In the dynamic world of economics, the Federal Reserve, the central bank…
