Economics
Navigating Trends: Exploring the Baltic Dry Index Chart
Unveiling the Baltic Dry Index Chart: Navigating Economic Trends and Insights Examine the Baltic Dry Index Chart Displayed Below. Despite Greenspan’s…


Unveiling the Baltic Dry Index Chart: Navigating Economic Trends and Insights
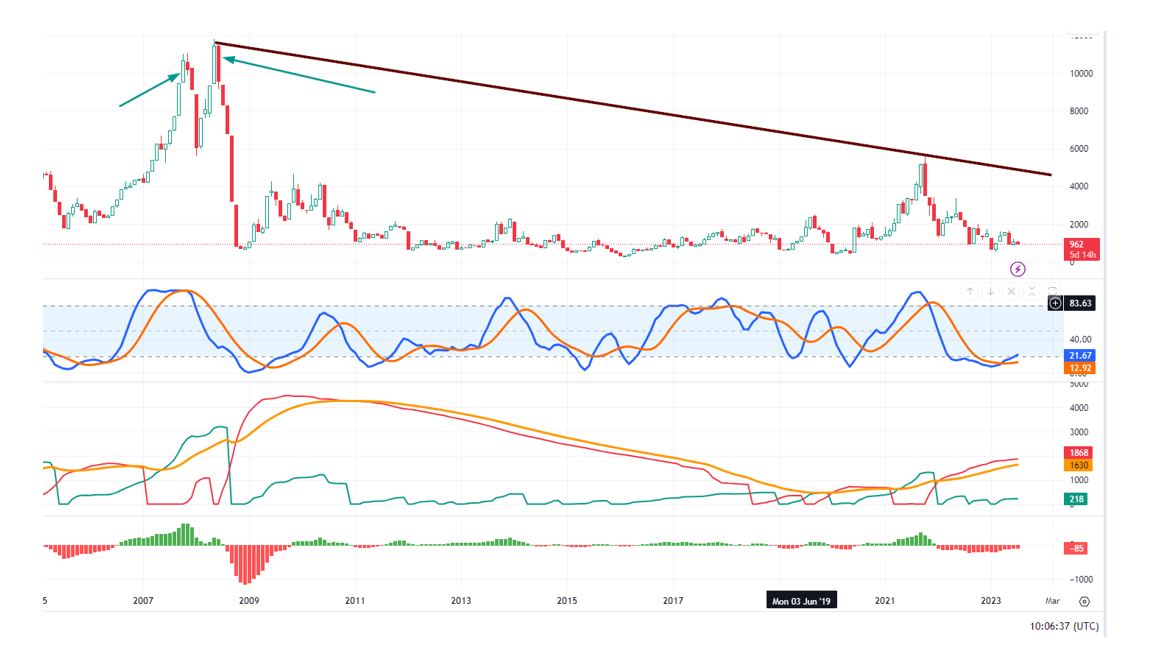
Examine the Baltic Dry Index Chart Displayed Below. Despite Greenspan’s efforts to inject money into the system, the amounts were insufficient to alter the landscape significantly. How can we deduce this? The BDI continued surging to new highs until 2009 when that trend abruptly stopped. What caused this? Free market forces were extinguished.
The BDI’s indication is clear: the US economy, and by extension, most Western-based economies, have never truly recovered. The patient is ailing and should have perished, but it is being artificially sustained through massive infusions of chemicals (in this case, cash) to extract as much as possible from the system. Real-time inflation, not the misleading data issued by the Fed and the BLS (Bureau of Labour Statistics), soared after that period.
Suppose one examines the economies of most Western countries. In that case, it becomes apparent that wealth revolves around the stock market, with many companies producing little in the way of tangible products – things essential for survival, such as food, energy, and essential medicines.
Taking a broader perspective, it becomes evident that despite the numerous cash infusions into the economy, the Baltic Dry Index (BDI), a prominent economic indicator, continued its upward trend until it peaked in 2009. Subsequently, even with trillions of dollars added to the system, the BDI performed like a sick creature.
Baltic Dry Index Chart: Tracking Trends from 1988 to 2023
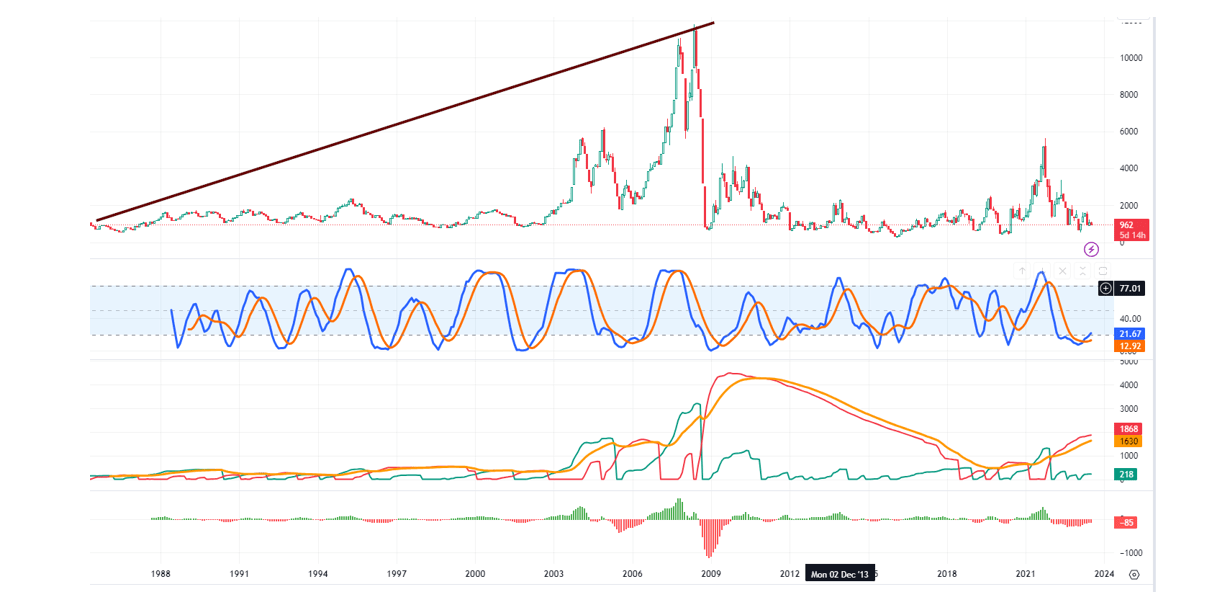
In May 2008, it achieved a high of 11,793. The next peak occurred on October 4, 2021, reaching 5,650, after the US injected 5 trillion dollars to address the COVID-19 crash. This fact is worth pondering: despite this massive infusion of cash before and after 2009, the BDI could not recover even 50% of its losses. This indicates that the BDI has been in a bearish state since 2008, and the global economic recovery is nothing more than an illusion, albeit an elaborate one.
In summary, this chart forewarns that, at some point, the consequences of our actions will catch up to us, resulting in an event reminiscent of the 1929 crash, wherein immense wealth will be obliterated. Our only recourse against this impending disaster lies in continuously monitoring the psychology of crowds and world governments.
Navigating Market Resistance and the Allure of NVDA
However, for now, the markets are resisting the Fed and all the proclamations from the Doctors of Doom. So, until bullish sentiment reaches or surpasses the 60 mark, strong corrections should be viewed through a bullish lens. However, we fear that NVDA, much like the internet darling CSCO in the past, is destined for a day of reckoning. At this stage, everyone seems to only see the bright side of the picture.
It’s essential to remember that NVDA sells shovels (graphic cards that everyone wants), which is a prime position to be in. However, the shovel makers must start generating profits, as many are spending recklessly without considering that they operate in the rapidly evolving AI sector. Similar to the dot-com era, companies investing in AI often overlook one critical aspect: at some point, the hype must translate into profits. Without profitability, the hype can only carry you so far before you hit a brick wall.
Conclusion
Although the Baltic Dry Index chart indicates that the economy may not be healthy in the long run, markets will likely overlook this in the short term. However, prudence suggests that the astute investor should transition out of stocks in the FOMO stage and shift their focus to stocks in the NCA (Nobody Cares About) stage. Until bullish sentiment reaches the 60 level and remains at this level for at least two consecutive weeks, it is improbable that the markets will experience a crash.
Other articles of interest

What is Inflation? Unveiling Effects and Strategies for Mastery
Investor Sentiment Data Manipulation: Unveiling Intriguing Insights

Stock Buybacks: Exploring Their Detrimental Effects

US Dollar Rally: Is it Ready to Rumble?

Investment Pyramid: A Paradigm of Value or Risky Hail Mary?
How the Hive Mind Mentality Influences Stock Market Losses

Unlock the Secrets: Learn How to Trade Options like a Pro!

Psychological Manipulation Techniques: Directed Perception

Tomorrow’s Stock Market Prediction: A Silly Pursuit?

When is the Best Time to Buy Stocks: Key Insights

Stock Market Forecast For Next 3 months: Buckle Up

Mass Psychology & Financial Success: An Overlooked Connection

Stock Market Crash 2023: Navigating the Turbulence Ahead

The Level Of Investment In Markets Indicates Fear Or Joy

Winning with Nasdaq 100 ETF: Riding the Right Side of the Trend
The post Navigating Trends: Exploring the Baltic Dry Index Chart appeared first on Tactical Investor.


Argentina Is One of the Most Regulated Countries in the World
In the coming days and weeks, we can expect further, far‐reaching reform proposals that will go through the Argentine congress.

Crypto, Crude, & Crap Stocks Rally As Yield Curve Steepens, Rate-Cut Hopes Soar
Crypto, Crude, & Crap Stocks Rally As Yield Curve Steepens, Rate-Cut Hopes Soar
A weird week of macro data – strong jobless claims but…

Fed Pivot: A Blend of Confidence and Folly
Fed Pivot: Charting a New Course in Economic Strategy Dec 22, 2023 Introduction In the dynamic world of economics, the Federal Reserve, the central bank…
