Economics
Nasdaq 100: Bulls may be too optimistic on US CPI
Nasdaq 100 continued to outperform against S&P 500, Dow Jones Industrial Average & Russell 2000. The K-shaped performance has widened between Nasdaq…
- Nasdaq 100 continued to outperform against S&P 500, Dow Jones Industrial Average & Russell 2000.
- The K-shaped performance has widened between Nasdaq 100 & the laggards.
- US sticky-price inflation for April remains elevated with a risk of a further increase in global food prices.
The US stock market on the aggregate rejoiced yesterday after the release of the US inflation data for April and the S&P 500 erased its earlier losses inflicted in the first half of this week.
The headline US consumer price index (CPI) has continued to slow down further as it recorded a 4.9% year-on-year growth from 5% in March, its 10th consecutive month of growth decline and slightly below expectations of 5%. The core CPI (excluding food and energy) come in within expectations and cooled slightly to 5.5% year-on-year from 5.6% printed in March.
In addition, a narrower price measure that several Federal Reserve officials are tracking closely; the core services inflation (excluding housing rent) has posted its smallest advance of 0.11% month-on-month since mid-2022. Overall, this latest set of inflationary data has raised the expectations of a pause in the Fed funds rate at 5.00%-5.25% to a probability of 91.5% from a chance of 78.8% from a day ago in the next upcoming FOMC meeting on 14 June based on the latest data obtained by the CME FedWatch Tool implied the pricing of the 30-day Fed Funds futures.
The Nasdaq 100 which is heavily weighted by the FAANG + MNT group (Meta/Facebook, Apple, Amazon, Netflix, Alphabet/Google, Microsoft, NVIDIA, Tesla) outperformed their peers with a daily return of +1.11% recorded yesterday, 10 May over the S&P 500 (+0.45%), the Dow Jones Industrial Average (-0.09%) and the Russell 2000 (+0.56%).
In contrast, an interesting observation to note is that the “cooler US CPI” optimism has not created a positive feedback loop into the prices of US regional banking stocks as the SPDR S&P Regional Banking ETF (KRE) recorded its 3rd daily consecutive loss and ended yesterday session with a negative return of -0.96% which suggests that the fear of a further credit crunch still persist due to the on-going the balance sheets stress of the US regional banks.
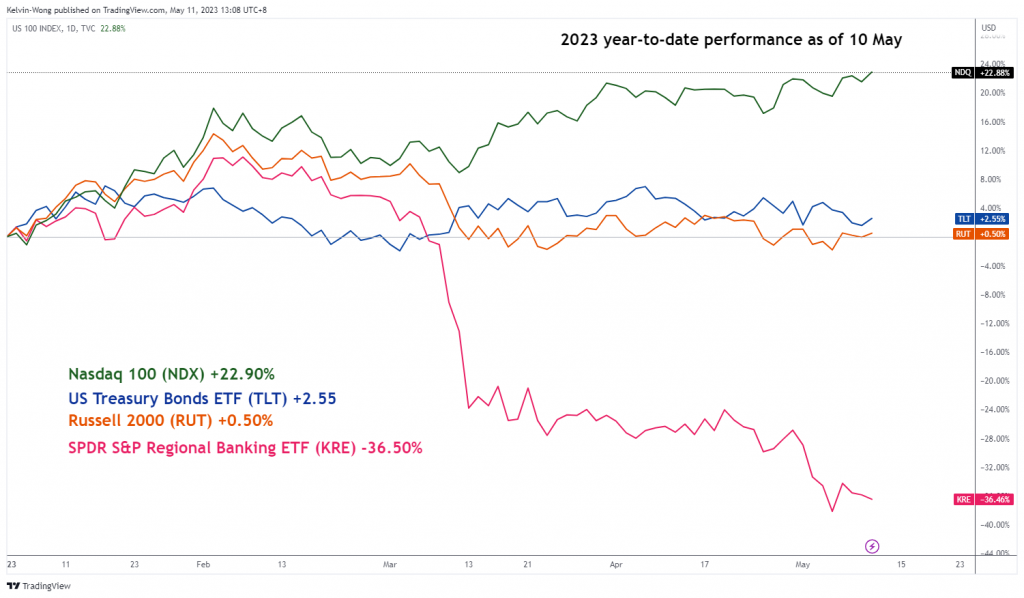
These stark discrepancies in performances among the long-duration risky assets; Nasdaq 100, Russell 2000, and long-duration risk-free assets (US Treasury bonds) since the start of the year can be seen as illustrated below.
K-shaped performance of the Nasdaq 100 has widened further against the laggards
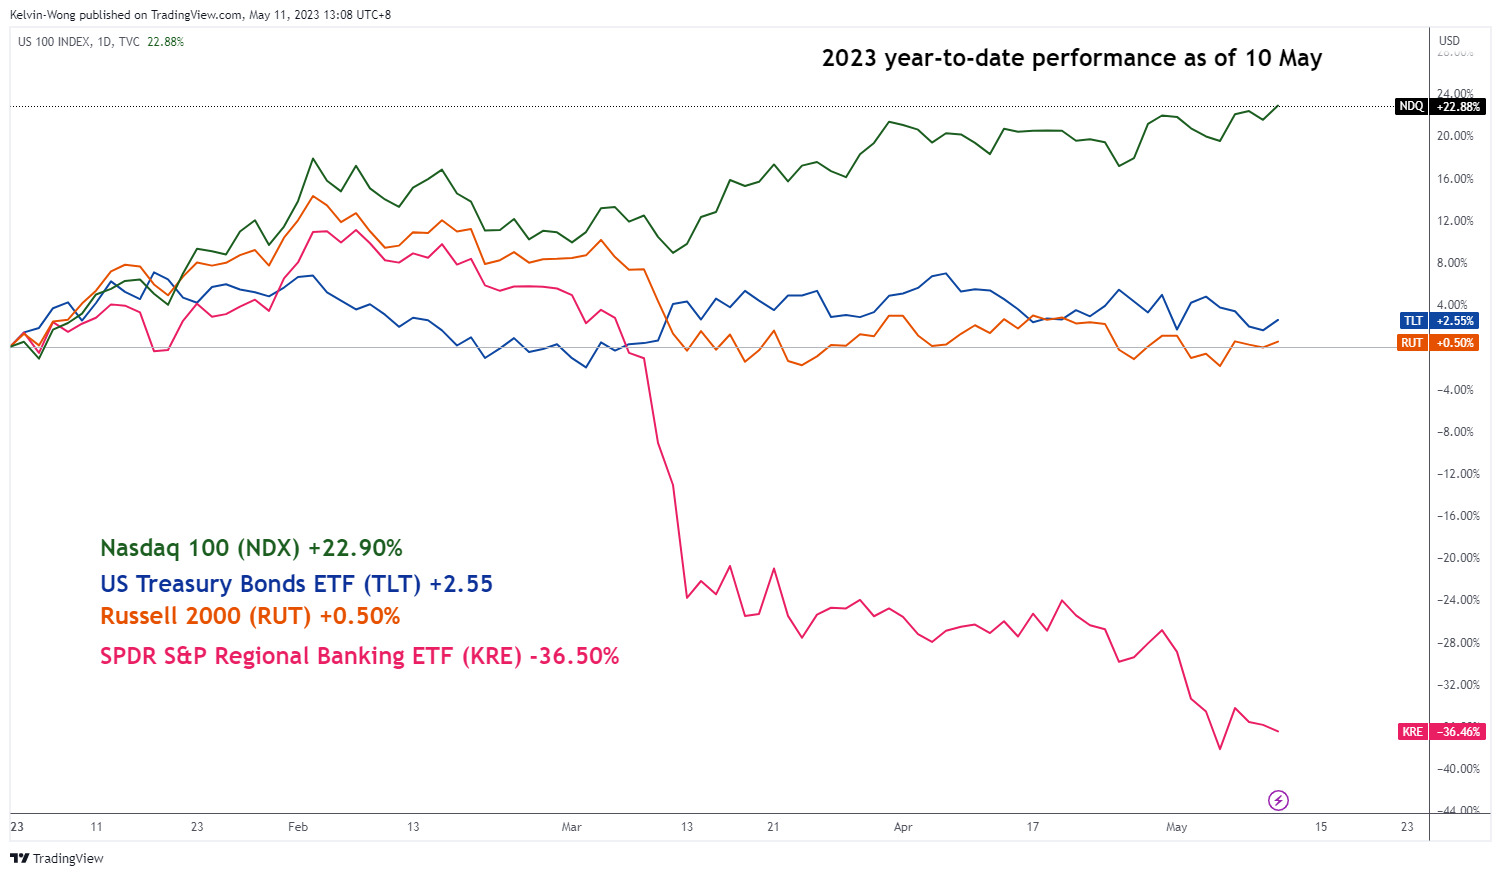
Fig 1: Year-to-date performance of Nasdaq 100, US Treasury Bonds, Russell 2000, US Regional Banks as of 10 May 2023
(Source: TradingView, click to enlarge chart)
Hence, this wide performance dispersion among these tradeable financial assets has increased the risk of mean reversion (closing the gap); either the laggards (Russell 2000, US regional banks, and US Treasury bonds) perform a positive catch-up with Nasdaq 100 or the Nasdaq 100 undergo a downside correction to be in line with the laggards.
One of the clues is to examine whether market participants have started to get too optimistic about the growth trajectory of US inflation (CPI) to come down fast enough in the next two months toward the Fed’s preferred target of 2% that justifies the current probability of 36% for the first interest rate cut of 25 basis points (bps) to take place on the July’s FOMC meeting and thereafter a total cut of 75 bps before 2023 ends based on the CME FedWatch Tool.
On a closer examination of the Federal Reserve Bank of Atlanta’s sticky-price CPI for April released yesterday on a weighted basket of items that change price relatively slowly has increased at the same pace as the previous month; 4.7% one-month annualized in April and only a slight dip on a year-on-year basis to 6.5% from 6.6% printed in March.
Global food prices may see upside pressure in the coming months
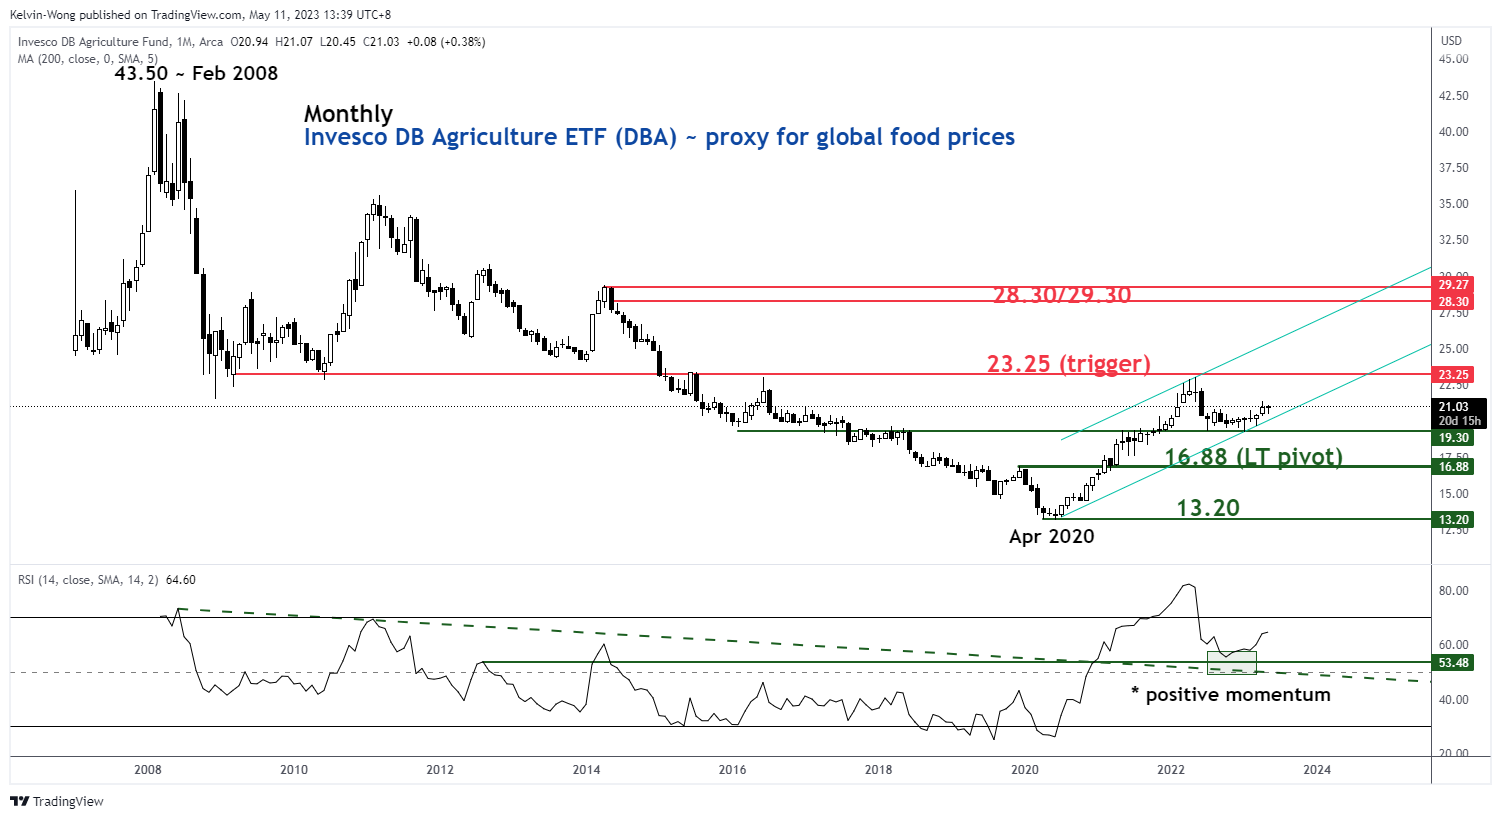
Fig 2: Invesco DB Agriculture ETF trend, a proxy of global food prices as of 10 May 2023 (Source: TradingView, click to enlarge chart)
In addition, a proxy of global food prices implied by the sentiment-driven market-transacted prices of the Invesco DB Agriculture ETF (DBA) has continued to surge to a 12-month high within a major uptrend phase in place since its April 2020 low.
Given that the current data on US sticky-price inflation growth is still elevated and the heightened risk of an increase in global food prices using the Invesco DB Agriculture ETF as a proxy, the headline US CPI inflationary growth may see an uptick in the coming months.
Hence, we cannot rule out that too much optimism is being priced at this juncture in advocating for an interest rate-cutting Fed Pivot in the second half of 2023. In turn, the leading Nasdaq 100 may face a negative mean reversion shock to adjust for such potential mispricing.


Argentina Is One of the Most Regulated Countries in the World
In the coming days and weeks, we can expect further, far‐reaching reform proposals that will go through the Argentine congress.

Crypto, Crude, & Crap Stocks Rally As Yield Curve Steepens, Rate-Cut Hopes Soar
Crypto, Crude, & Crap Stocks Rally As Yield Curve Steepens, Rate-Cut Hopes Soar
A weird week of macro data – strong jobless claims but…

Fed Pivot: A Blend of Confidence and Folly
Fed Pivot: Charting a New Course in Economic Strategy Dec 22, 2023 Introduction In the dynamic world of economics, the Federal Reserve, the central bank…


