
Technical View: Markets to Watch for the Week Ahead
Currencies:
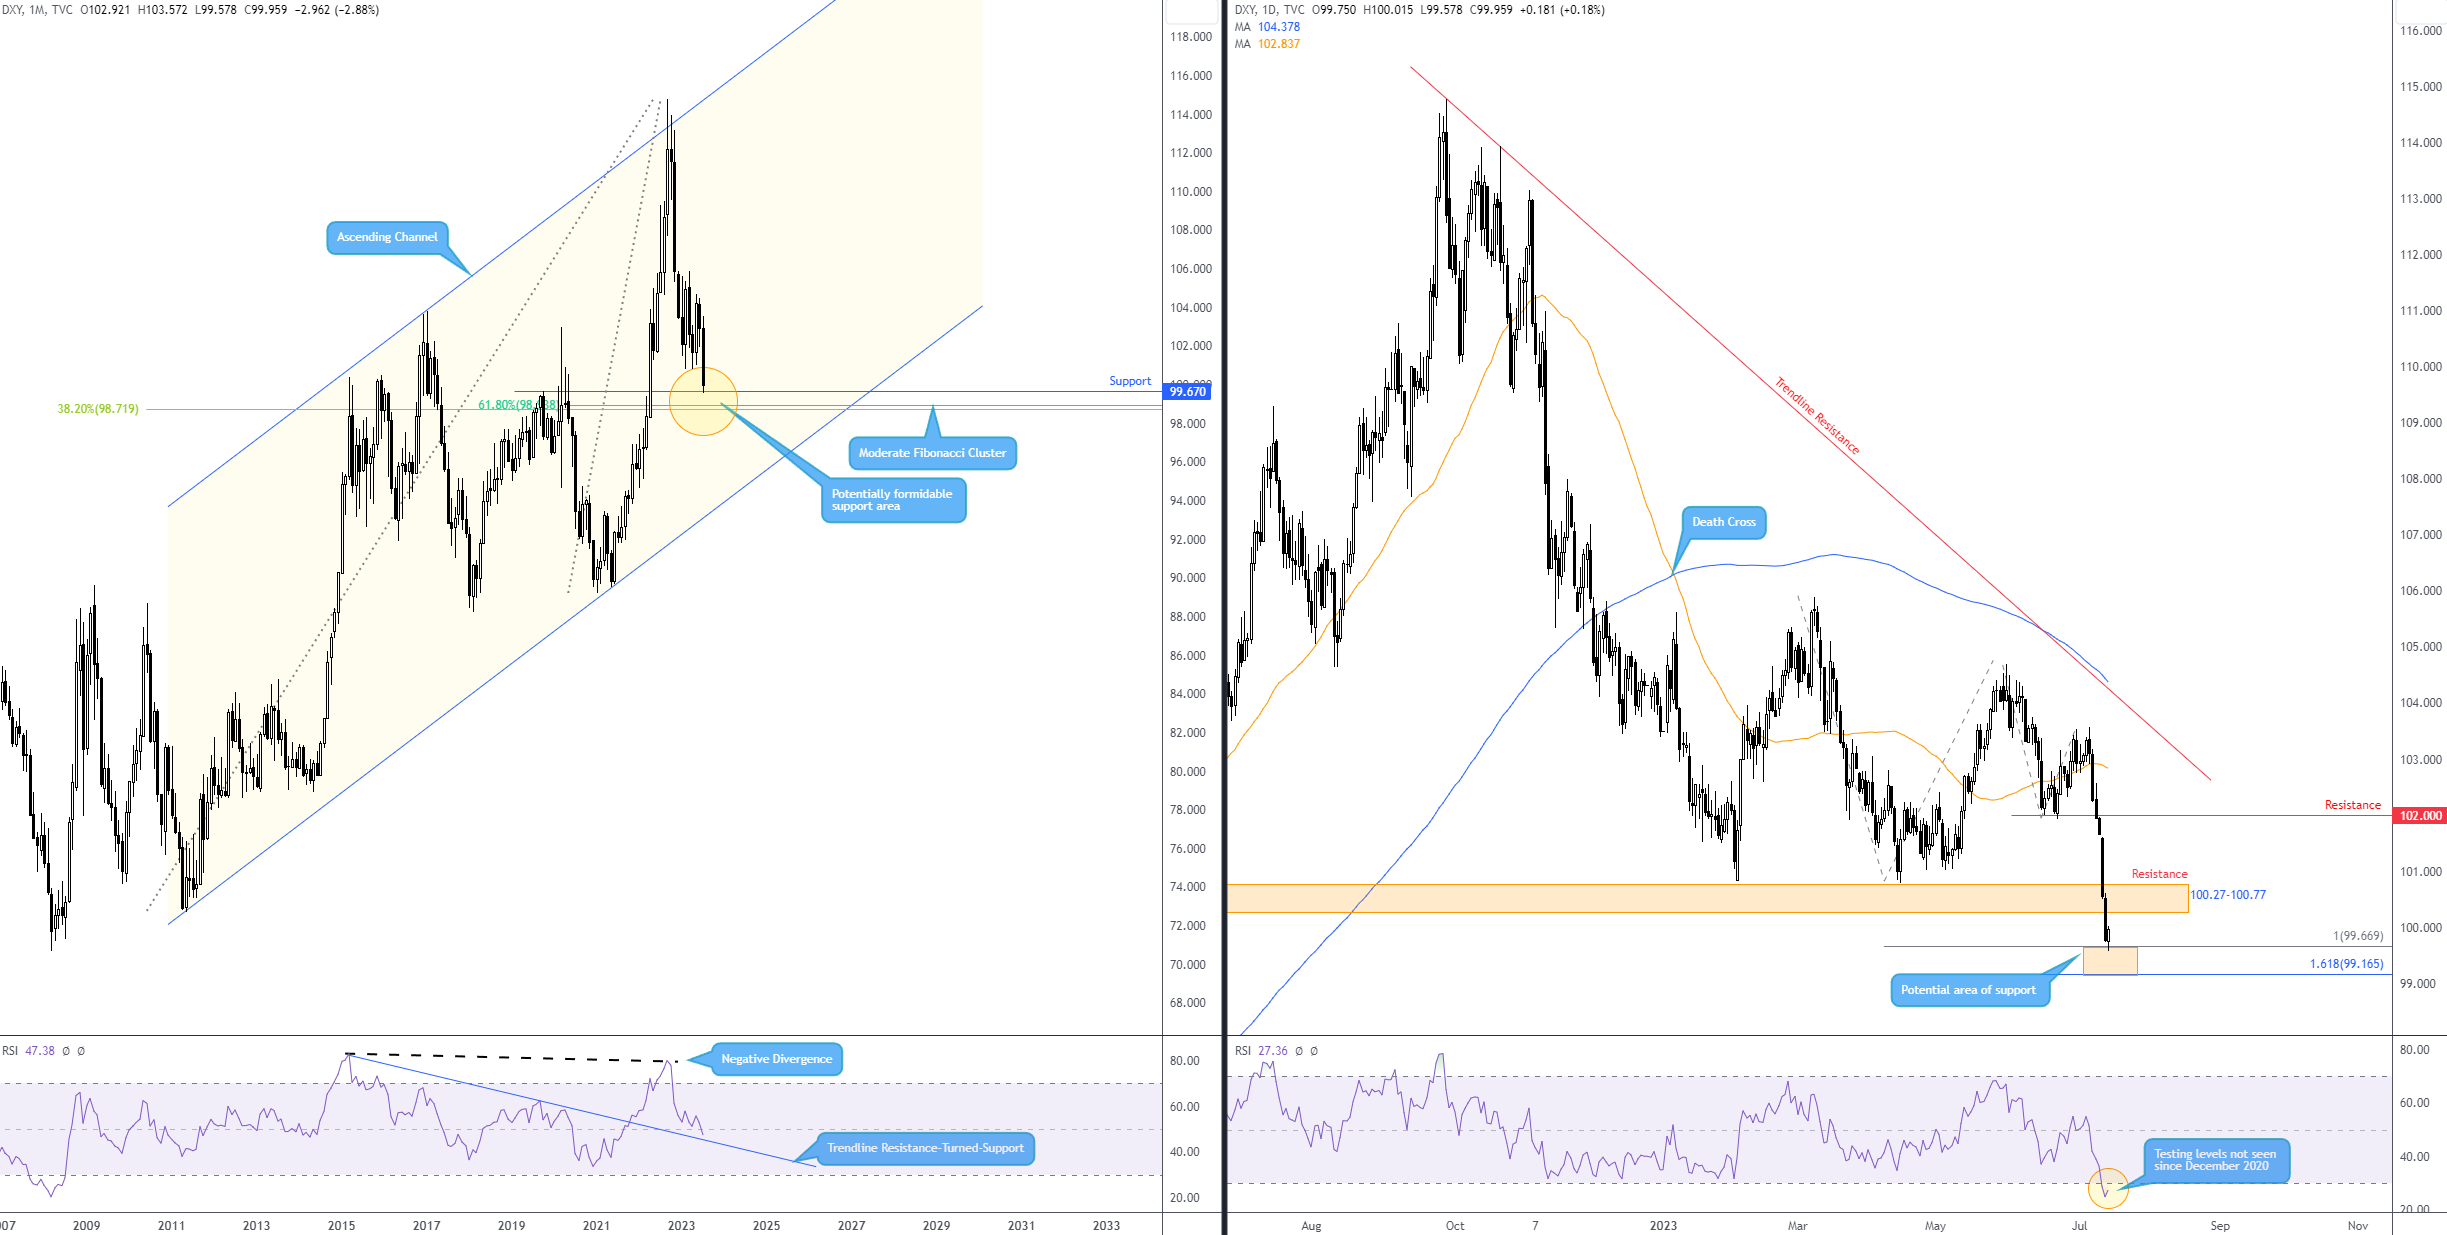
US Dollar Testing Monthly Support
It has been quite a week for the US dollar. Consistent with the US Dollar Index—a geometrically-weighted average of the dollar’s value against a basket of six major currencies, including Europe’s single currency—the greenback plunged -2.3% last week, marking its largest one-week decline this year, along with refreshing YTD lows and driving price action into the hands of monthly support from 99.67.
Technically, as featured in last week’s Weekly Market Insight, trend studies on the monthly timeframe show price action has been northbound since bottoming in 2008 at 70.70 if one focusses on the longer-term swings. Q4 (2022), as you can see, staged a noteworthy correction from 114.78 (from channel resistance), which remains active in 2023. Predictably, due to the fractal nature of the markets, this displayed a visible downtrend on the daily chart, which also remains active.
With price action on the monthly timeframe now shaking hands with support at 99.67—a level I have watched for several months—this heavy-weight barrier, complemented by two neighbouring Fibonacci ratios (38.2% and 61.8%) at 98.72 and 98.95, respectively, may prove difficult to conquer. It is worth noting that this area is further reinforced by nearby indicator trendline resistance-turned-support drawn from the high of 82.87 from the Relative Strength Index (RSI). As highlighted in previous writing, the RSI tends to establish support around the 40.00-50.00 area in trending environments; consequently, many use this zone as a temporary oversold base to locate positive divergence.
On the daily timeframe, after clearing support from 100.27-100.77, price action is now seen testing a 100% projection ratio at 99.67 (many will recognise this as an equal AB=CD bullish formation). Also nearby is a 1.618% Fibonacci projection ratio at 99.17 (‘alternate’ AB=CD bullish pattern). Despite these bullish AB=CD patterns often performing more effectively when taken in uptrends (not downtrends), the RSI explores the oversold space, touching levels not seen since December 2020, which could underpin current AB=CD support. If this support zone does indeed cede ground, the lower side of monthly support (the two Fibonacci ratios at around 98.80ish) will likely welcome price action.
Considering the above analysis, the combination of monthly and daily support may inspire profit-taking this week, leading the index back to at least daily resistance of 100.27-100.77. Any movement north of here, and we could see the unit aim for daily resistance as far north as 102.00. Technically speaking, although the trend is south on the daily timeframe, shorting a break of current daily support (99.17-99.67) will likely be too precarious for many traders knowing they would essentially be selling into the monthly support area.
 Commodities:
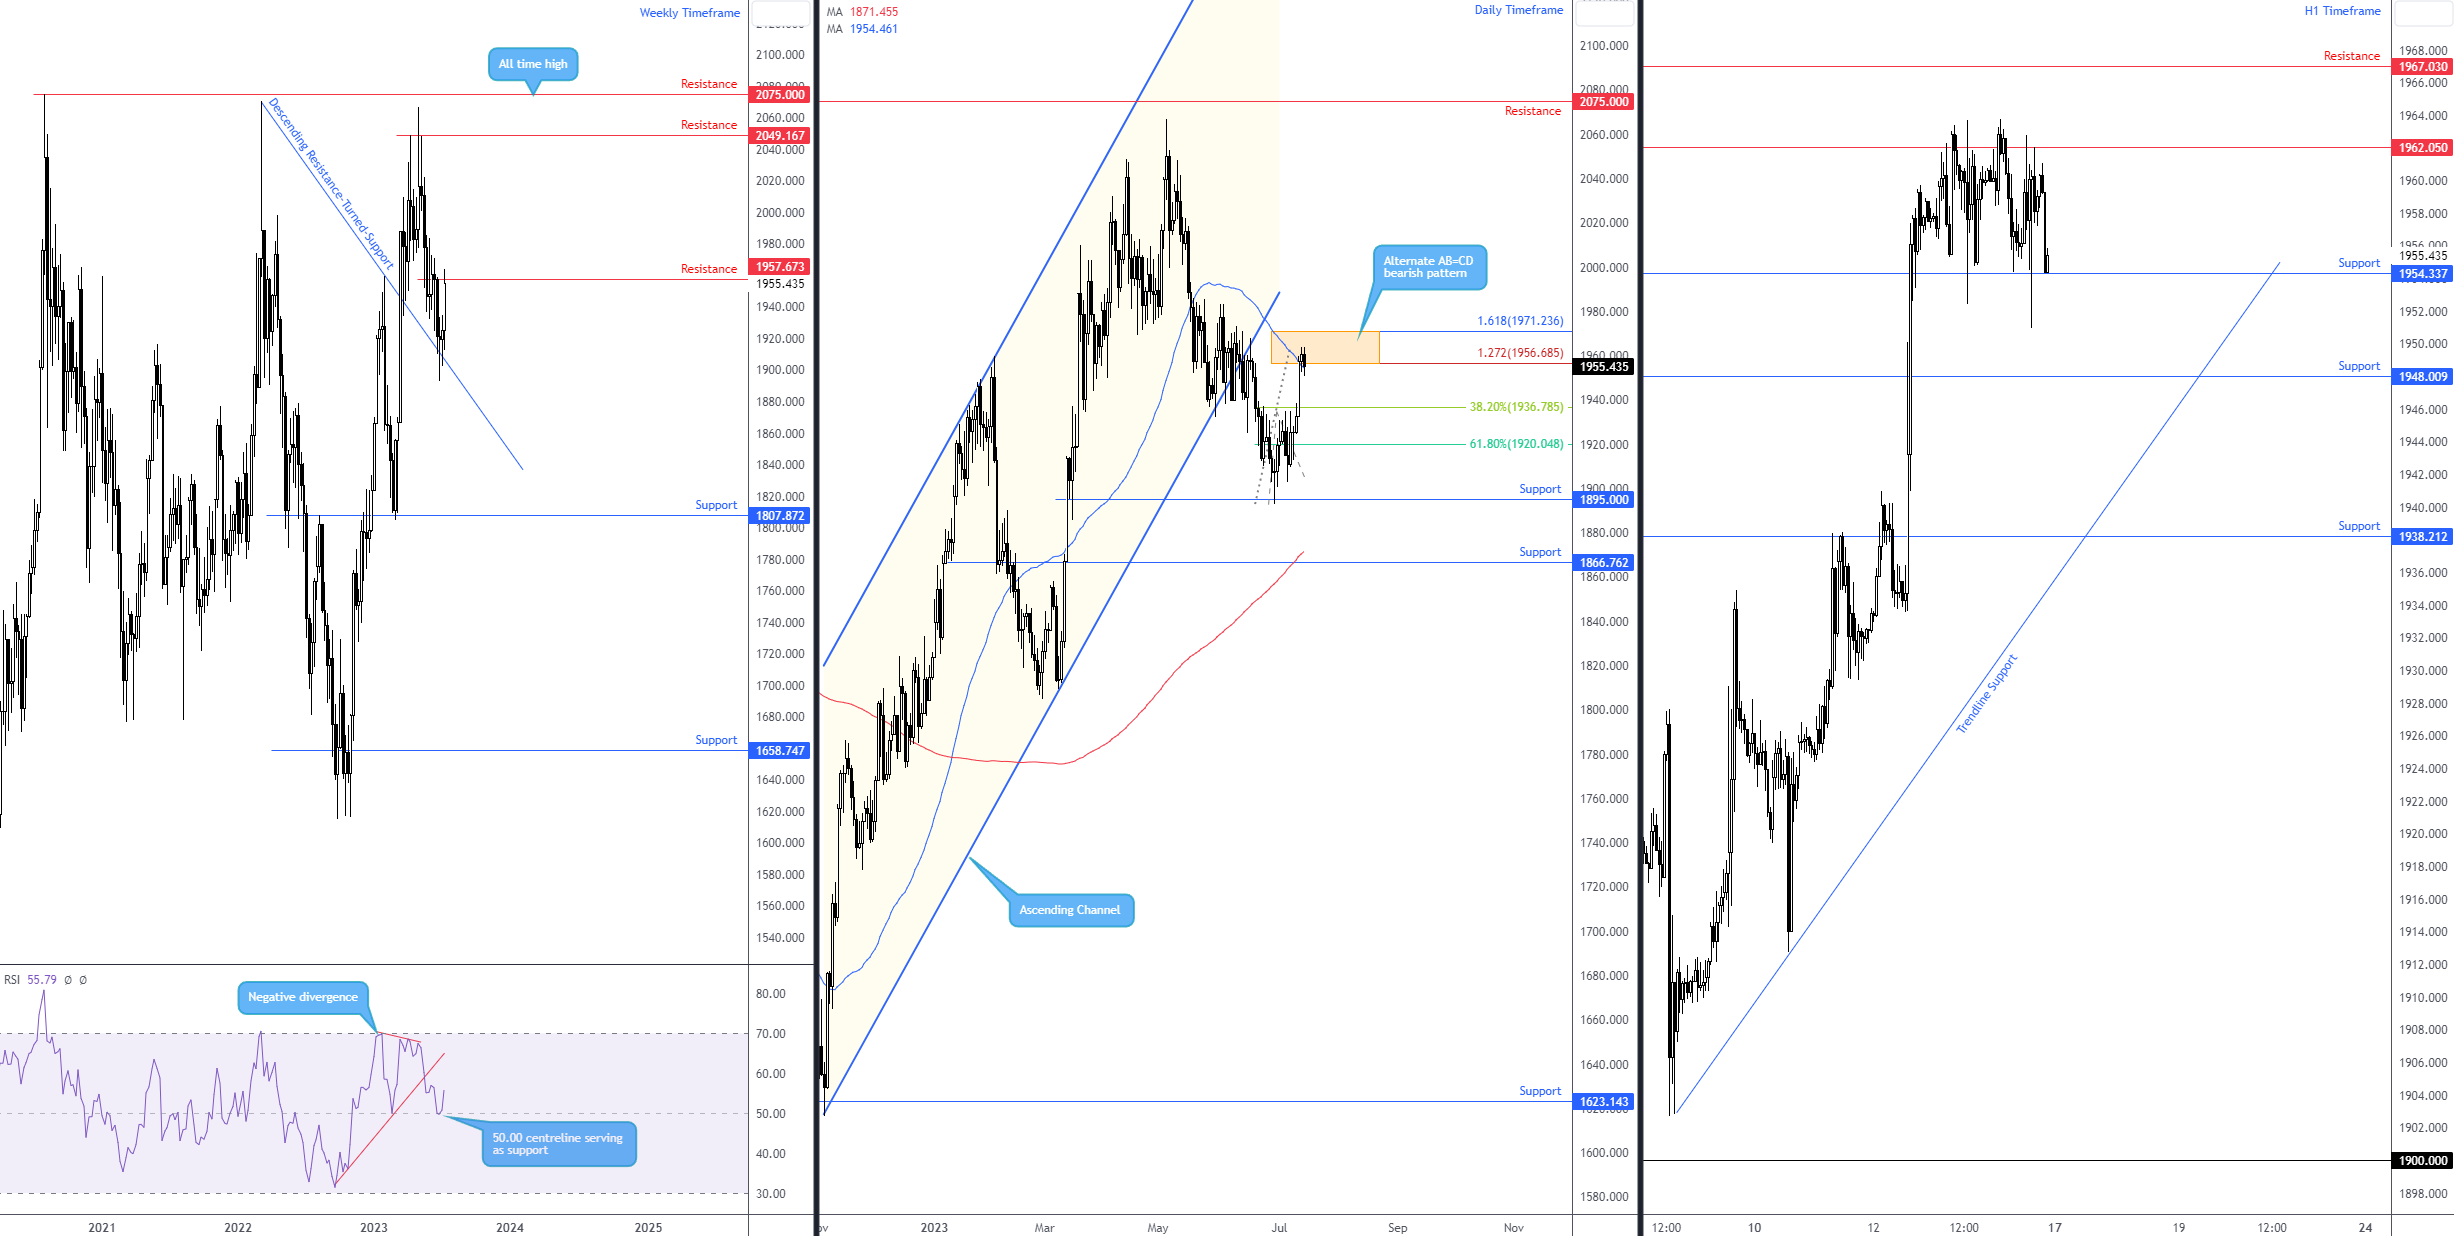
Short-Term Range Support Vulnerable on XAU/USD
Spot gold, in $ terms, chalked up its largest one-week advance since March last week, adding +1.6%.
The end of June witnessed the yellow metal discover a (technical) floor from a descending resistance-turned-support line taken from the high of $2,070 on the weekly timeframe. Notably, this was reinforced by the Relative Strength Index (RSI) finding support off the 50.00 centreline, which is common in markets that are trending higher (we have been higher on the weekly scale since bottoming at $1,614). I do not see any obvious resistance on the weekly chart until $2,049. However, $1,957 may prove troublesome for bulls this week (the decision point formed before price navigated lower and tested the descending support).
Joining the weekly timeframe’s descending support was support on the daily timeframe marked at $1,895. As you can see, since recoiling from the aforementioned level, price recently overthrew the 50-day simple moving average at $1,954. While closing north of the 50-day SMA is considered by some to be a bullish signal, we have simultaneously established an ‘alternate’ AB=CD resistance formation, delivering a resistance zone between $1,971 and $1,956 (1.618% and 1.272% Fibonacci projection ratios). Therefore, this could attract bearish hands this week, in line with the daily chart’s early downtrend, and target the 38.2% and 61.8% Fibonacci ratios at $1,936 and $1,920, respectively (derived from legs A-D).
From a shorter-term perspective, you will note that the second half of last week entered a consolidation phase on the H1 chart between resistance from $1,962 and support at $1,954. Nearby levels outside the aforesaid range to be aware of this week are resistance at $1,967 and support at $1,948.
So, acknowledging weekly price may turn from $1,957, in addition to daily price testing the mettle of an alternate AB=CD resistance zone between $1,971 and $1,956 (as well as trending south), a breakout below the H1 timeframe’s range between $1,962 and $1,954 could be seen. H1 support from $1,948 will likely demand attention should the above come to fruition, with further selling potentially shining light on H1 support at $1,938, which closely aligns with the initial support target on the daily chart at $1,936.
 Equities:
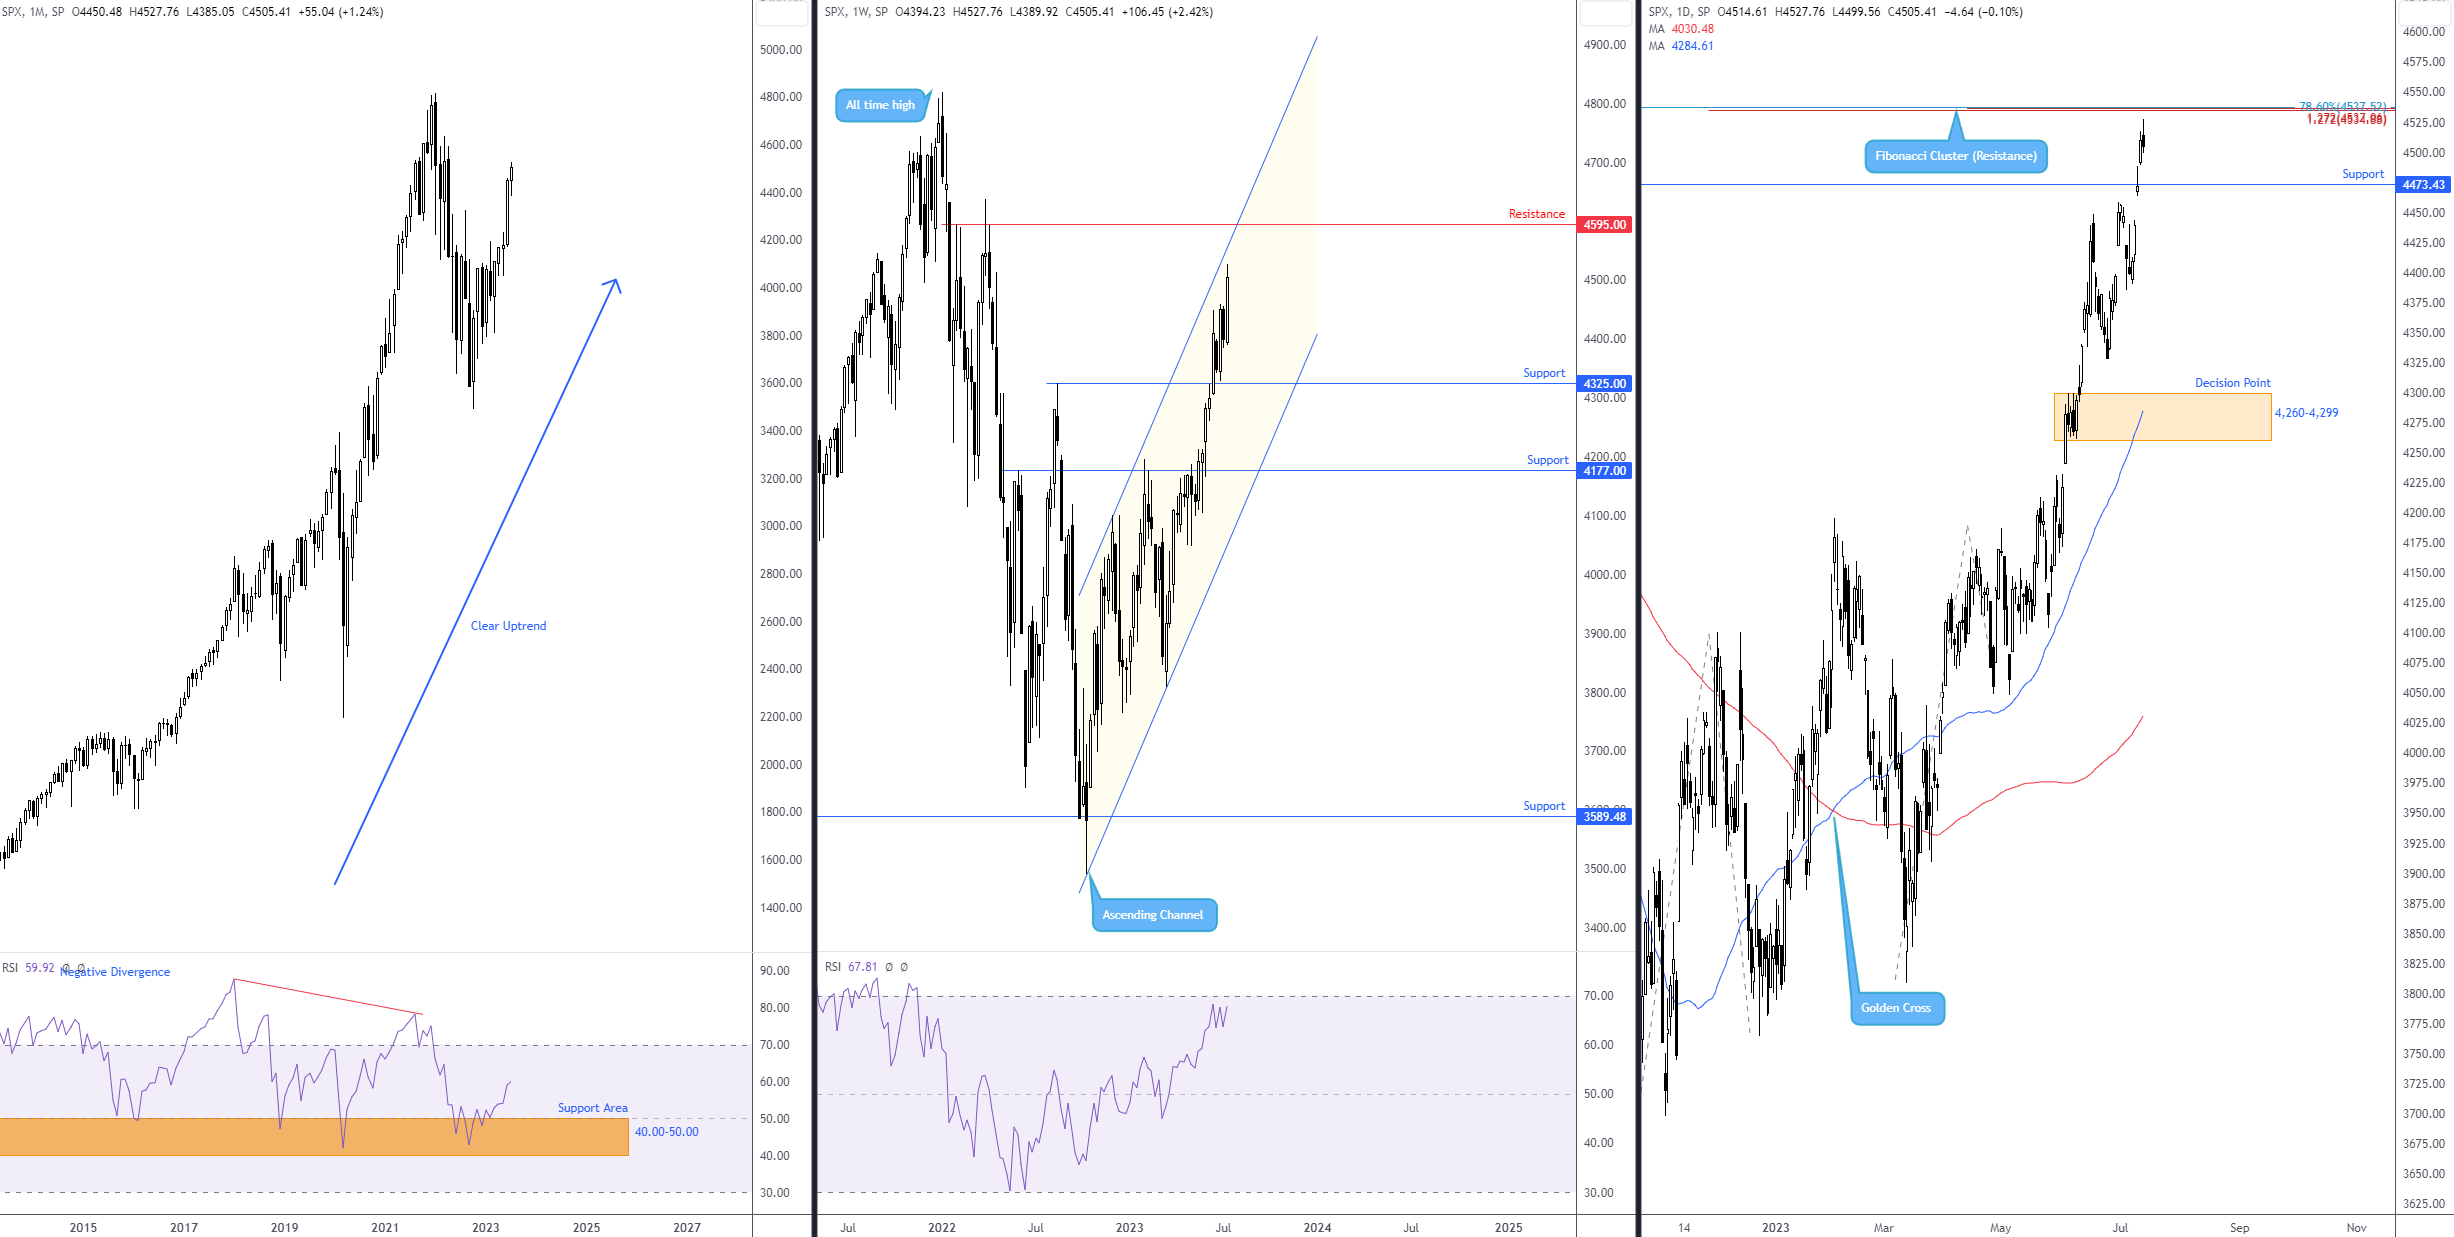
S&P 500 Closing in on Resistance
After chalking up a fourth consecutive month in the green (June +6.5%), aided by the Relative Strength Index (RSI) on the monthly timeframe rebounding from support between 40.00 and 50.00 (common in strong uptrends), the S&P 500 is fast approaching the all-time high at 4,818 set at the beginning of 2022.
Price action on the weekly timeframe held firm north of 4,325 (now support) and, thanks to last week’s +2.4% rally, is within a stone’s throw from channel resistance drawn from the high of 4,100, followed by resistance at 4,595. Also of technical relevance, the weekly RSI draws near overbought territory (likely to strike overbought once/if price action tests the aforementioned channel resistance).
For those who read the latest Pattern Pulse, you may recall that the Research Team noted the following on the S&P 500 (italics):
Acknowledging the scope to navigate higher on the monthly and weekly timeframes, price action on the daily timeframe recently tested the courage of resistance at 4,473 (and likely filled buy-stops). It could eventually open the door for breakout buying towards a daily Fibonacci Cluster at 4,537.
As evident from the daily timeframe, we have seen price breakout north of 4,473 (now marked support), with the index finishing the week within striking distance of the Fibonacci Cluster, set nearby the weekly timeframe’s channel resistance. Consequent to this, despite the monthly, weekly and daily timeframes exhibiting strong uptrends, buyers could experience some opposition at 4,537ish this week. Alternatively, a breakout beyond the noted base paves the way north for further outperformance towards weekly resistance at 4,595.
 Cryptocurrencies:
BTC/USD to Breach Weekly Resistance?
Against the US dollar, Bitcoin refreshed YTD pinnacles last week, touching $31,862, a level not seen since June 2022 (note that this market has been trending higher since November 2022). Weekly resistance at $30,644, as you can see, remains in the frame, though it has (so far) failed to excite sellers. Although I am not overlooking a possible correction to weekly trendline support (taken from the low of $16,326), the lack of bearish intent seen at resistance could eventually spur further gains for the major crypto around current price. Assuming buyers take the wheel this week, limited resistance is seen on the weekly timeframe until $32,933.
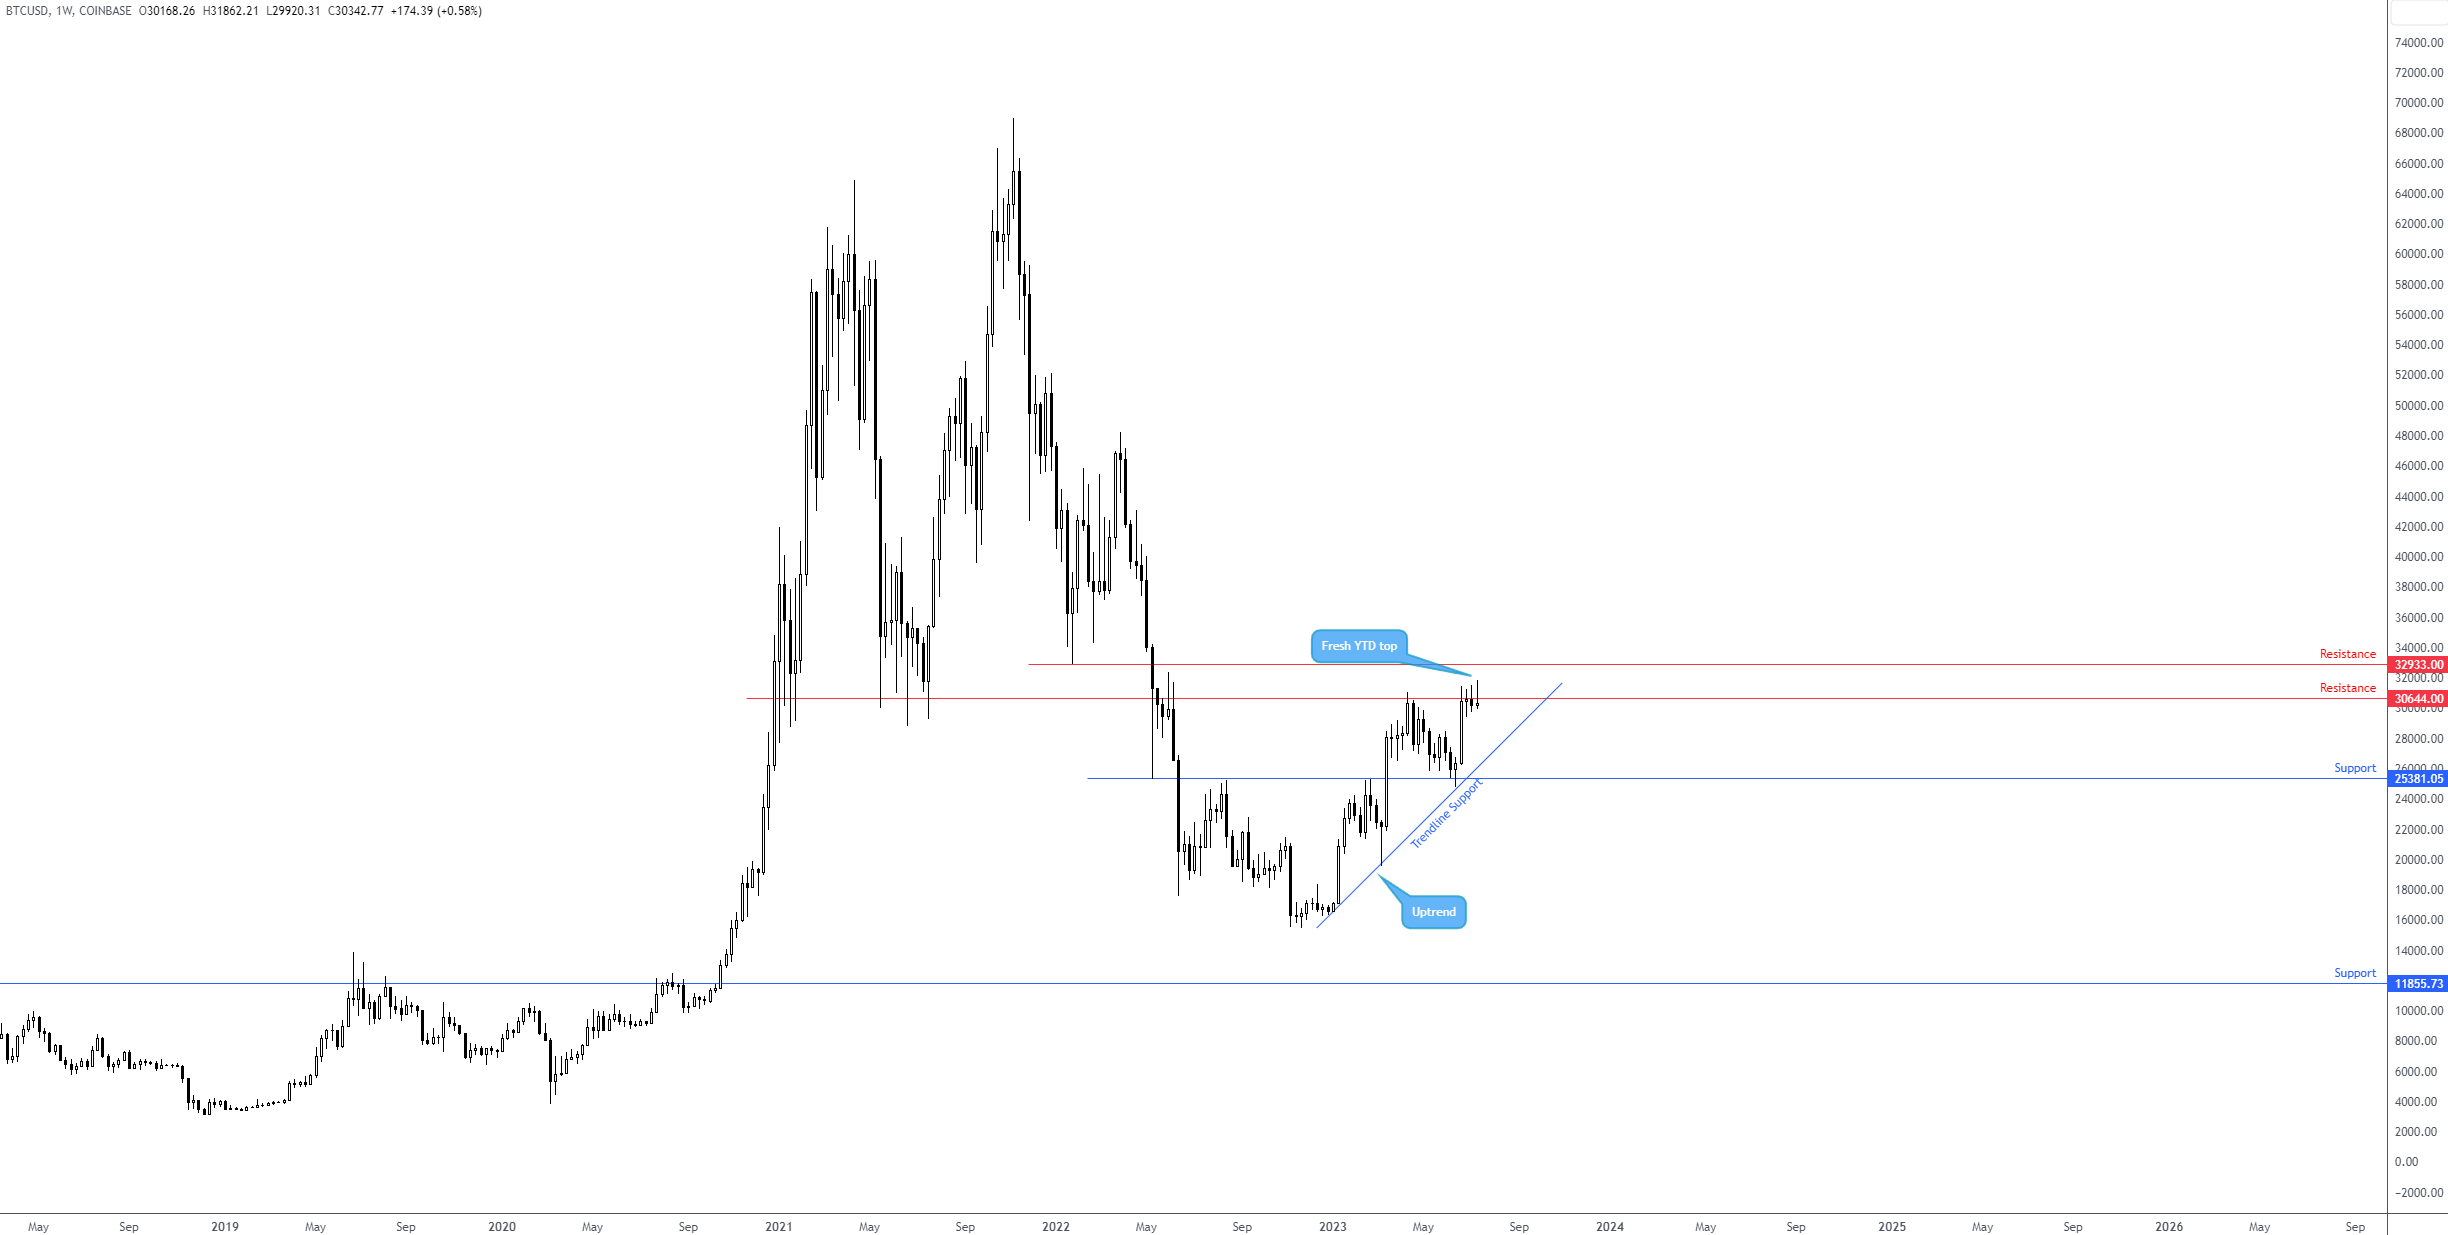 Moving across to the daily timeframe, I see a potential pennant pattern forming between $29,417 and $31,443. Some may disagree here, but it is important to note that in some cases, pennant patterns do not form against the predominant trend: they can be horizontal or, as in the case here, in line with the trend. Do not confuse this with the wedge pattern; these are longer-term formations.
Active resistance is also seen at $31,404, with support visible at $29,383 (nearby the 50-day simple moving average of $28,566). As suggested by the weekly timeframe’s uptrend, as well as a clear uptrend on the daily timeframe, price might drive through weekly/daily resistance at $30,644/$31,404 this week, a move opening the door to weekly resistance from $32,933 and potentially resistance on the daily timeframe at $34,048.
 Charts: TradingView
Check out last week’s Markets Insights… Read More
Disclaimer: The information contained in this material is intended for general advice only. It does not take into account your investment objectives, financial situation or particular needs. FP Markets has made every effort to ensure the accuracy of the information as at the date of publication. FP Markets does not give any warranty or representation as to the material. Examples included in this material are for illustrative purposes only. To the extent permitted by law, FP Markets and its employees shall not be liable for any loss or damage arising in any way (including by way of negligence) from or in connection with any information provided in or omitted from this material. Features of the FP Markets products including applicable fees and charges are outlined in the Product Disclosure Statements available from FP Markets website, www.fpmarkets.com and should be considered before deciding to deal in those products. Derivatives can be risky; losses can exceed your initial payment. FP Markets recommends that you seek independent advice. First Prudential Markets Pty Ltd trading as FP Markets ABN 16 112 600 281, Australian Financial Services License Number 286354.
Opinions are personal to the authors and do not reflect the opinions of LeapRate. This is not a trading advice.
The post Market Insight: Week ending 21 July appeared first on LeapRate.
dollar
gold
derivatives
commodities
markets
us dollar


