Economics
Look Out for Outlook-at-Risk
The timely characterization of risks to the economic outlook plays an important role in both economic policy and private sector decisions. In a February…


The timely characterization of risks to the economic outlook plays an important role in both economic policy and private sector decisions. In a February 2023 Liberty Street Economics post, we introduced the concept of “Outlook-at-Risk”—that is, the downside risk to real activity and two-sided risks to inflation. Today we are launching Outlook-at-Risk as a regularly updated data product, with new readings for the conditional distributions of real GDP growth, the unemployment rate, and inflation to be published each month. In this post, we use the data on conditional distributions to investigate how two-sided risks to inflation and downside risks to real activity have evolved over the current and previous five monetary policy tightening cycles.
Monetary Policy Affects Outlook-at-Risk through Financial Conditions
The Federal Open Market Committee (FOMC) began the current tightening cycle on March 16, 2022, and has increased the target range for the federal funds rate by 5 percentage points since then. As the chart below shows, this speed of tightening is unusual relative to the previous five monetary policy cycles, reflecting the challenges of addressing inflationary shocks. In particular, the chart—often referred to as a “spider chart”—shows the cumulative change in the monthly average effective federal funds rate relative to its value in the month of the first rate increase in each tightening cycle (denoted by month 0).
Monetary Policy Has Tightened at an Unprecedented Pace
This Cycle
Notes: The chart shows the cumulative change in the monthly average federal funds rate relative to its value in the first month of each tightening cycle. These dates correspond to January 1987, February 1994, June 1999, June 2004, December 2015, and March 2022.
Tighter monetary policy affects financial conditions in several ways: by raising the expected path of short-term rates, by changing expected discounted future cash flows of interest-rate-sensitive securities, by changing aggregate uncertainty, and by changing market participants’ perceptions of risk. This so-called asset price channel of monetary policy implies that tighter monetary policy translates into tighter financial conditions as risk-free yields, credit spreads, and equity risk premia rise. As we discussed in our previous post, the probability of declines in real activity rises as financial conditions tighten. Given the unprecedented pace of the rise of the short rate, have risks to the outlook evolved similarly to those of past tightening cycles?
Monetary Policy Tightening Has Decreased Upside Risks to Inflation…
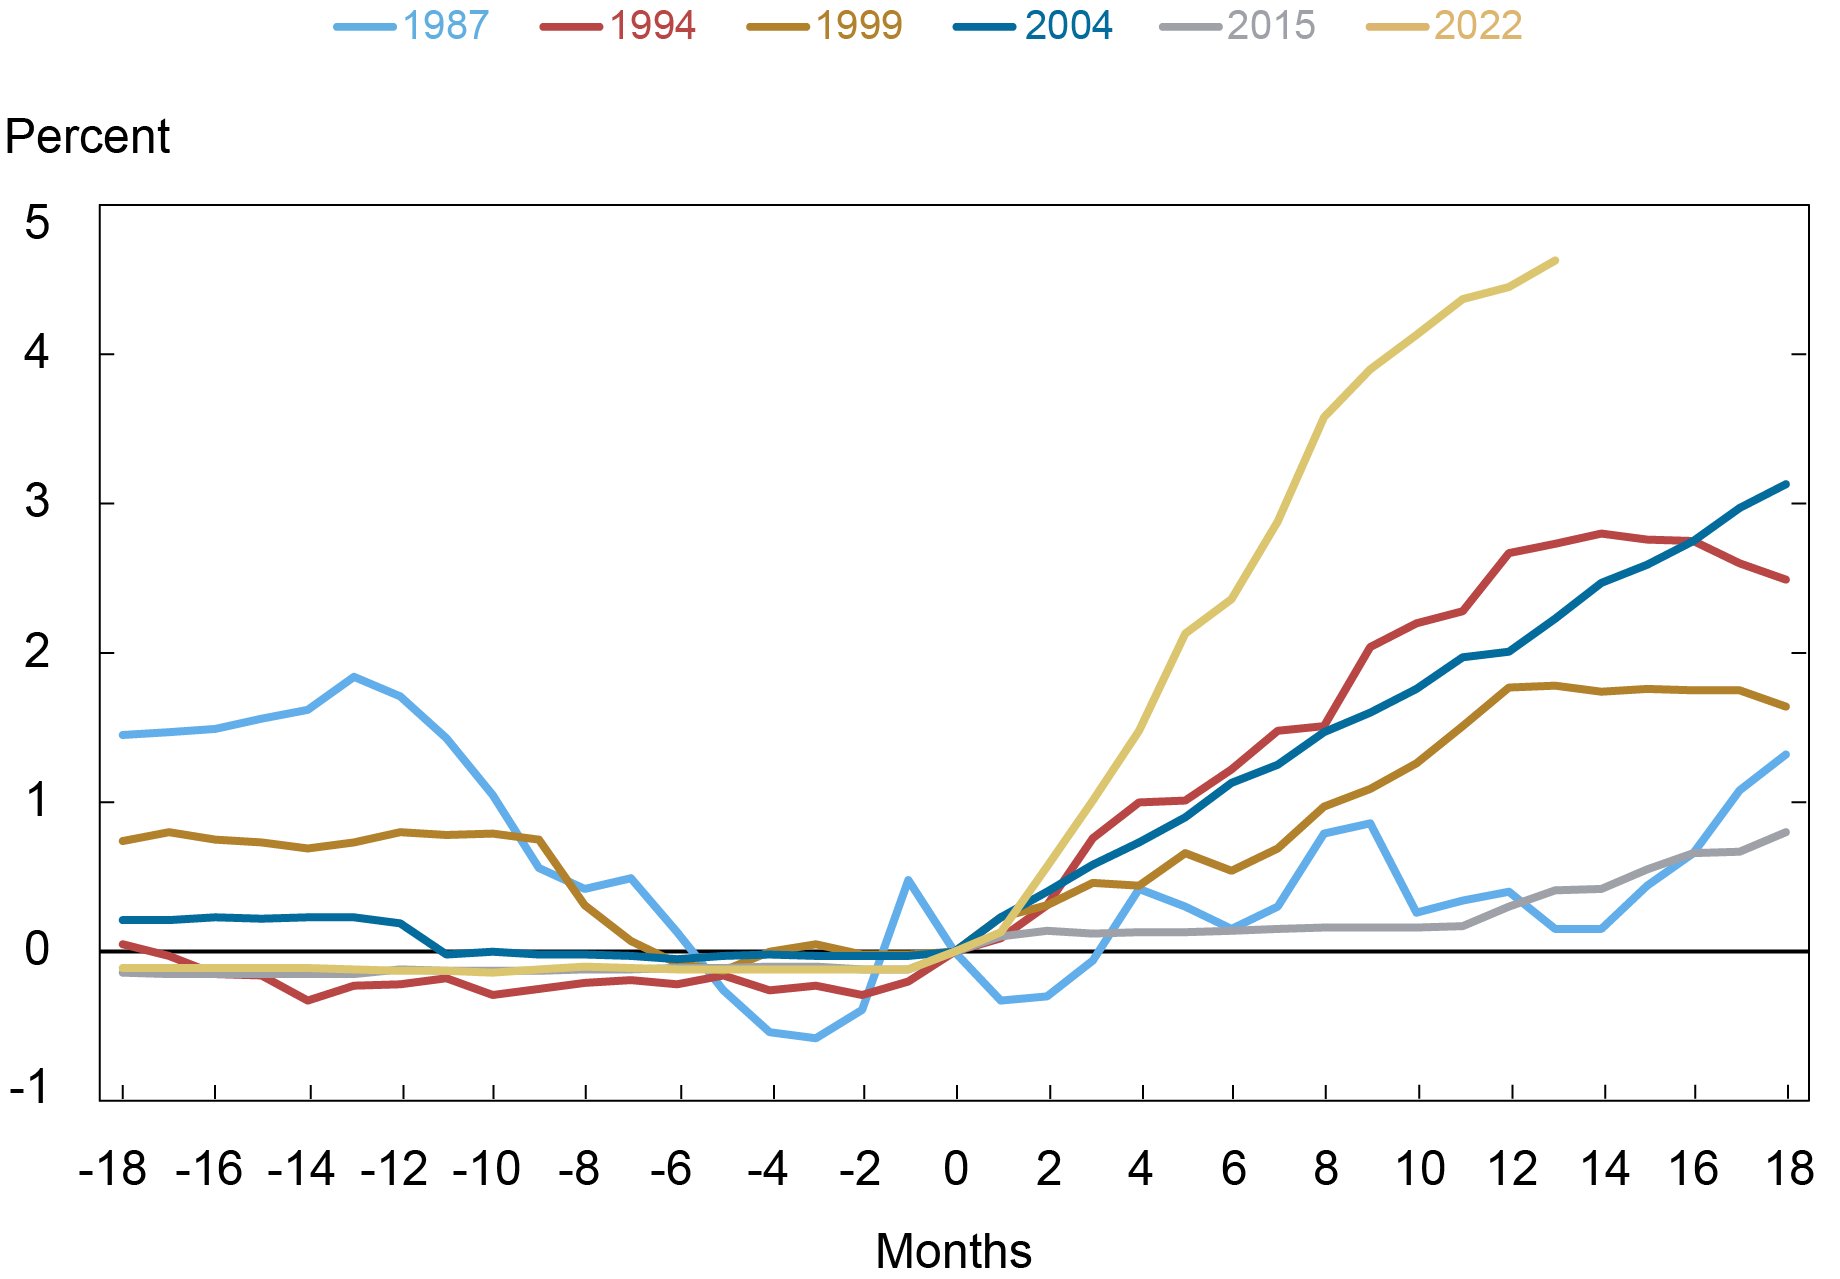
As laid out in numerous policy statements, the FOMC has tightened monetary policy in response to rising inflation and concerns about possible unanchoring of inflation expectations. The spider chart below plots the evolution of a measure of the right tail of the outlook for the next four quarters’ average CPI inflation—the 90th percent quantile (or 90th percentile)—over the current and previous five monetary policy tightening cycles. The chart shows a rapid outsized increase in the right tail of the inflation outlook beginning around six months prior to the start of the current tightening cycle. The 90th percentile of the conditional distribution for the next four quarters’ average CPI inflation plateaued once monetary policy tightening commenced, and then started decreasing over recent months (but the level remains somewhat elevated relative to prior experience, as shown here). In contrast, movements in the right tail of the conditional distribution of inflation over the last five tightening cycles have been much more modest. Moreover, it is worth noting that the significant decline in the right tail of the distribution following the start of the current tightening cycle is not a feature common to previous tightening cycles.
Upside Risks to Inflation Moderated in Late 2022
Notes: The chart shows the cumulative change in the 90th percentile of the conditional distribution of the next four quarters’ average CPI inflation relative to its value in the first month of each tightening cycle. These dates correspond to January 1987, February 1994, June 1999, June 2004, December 2015, and March 2022.
…But Downside Risks to Inflation Have Increased over the Current Tightening Cycle
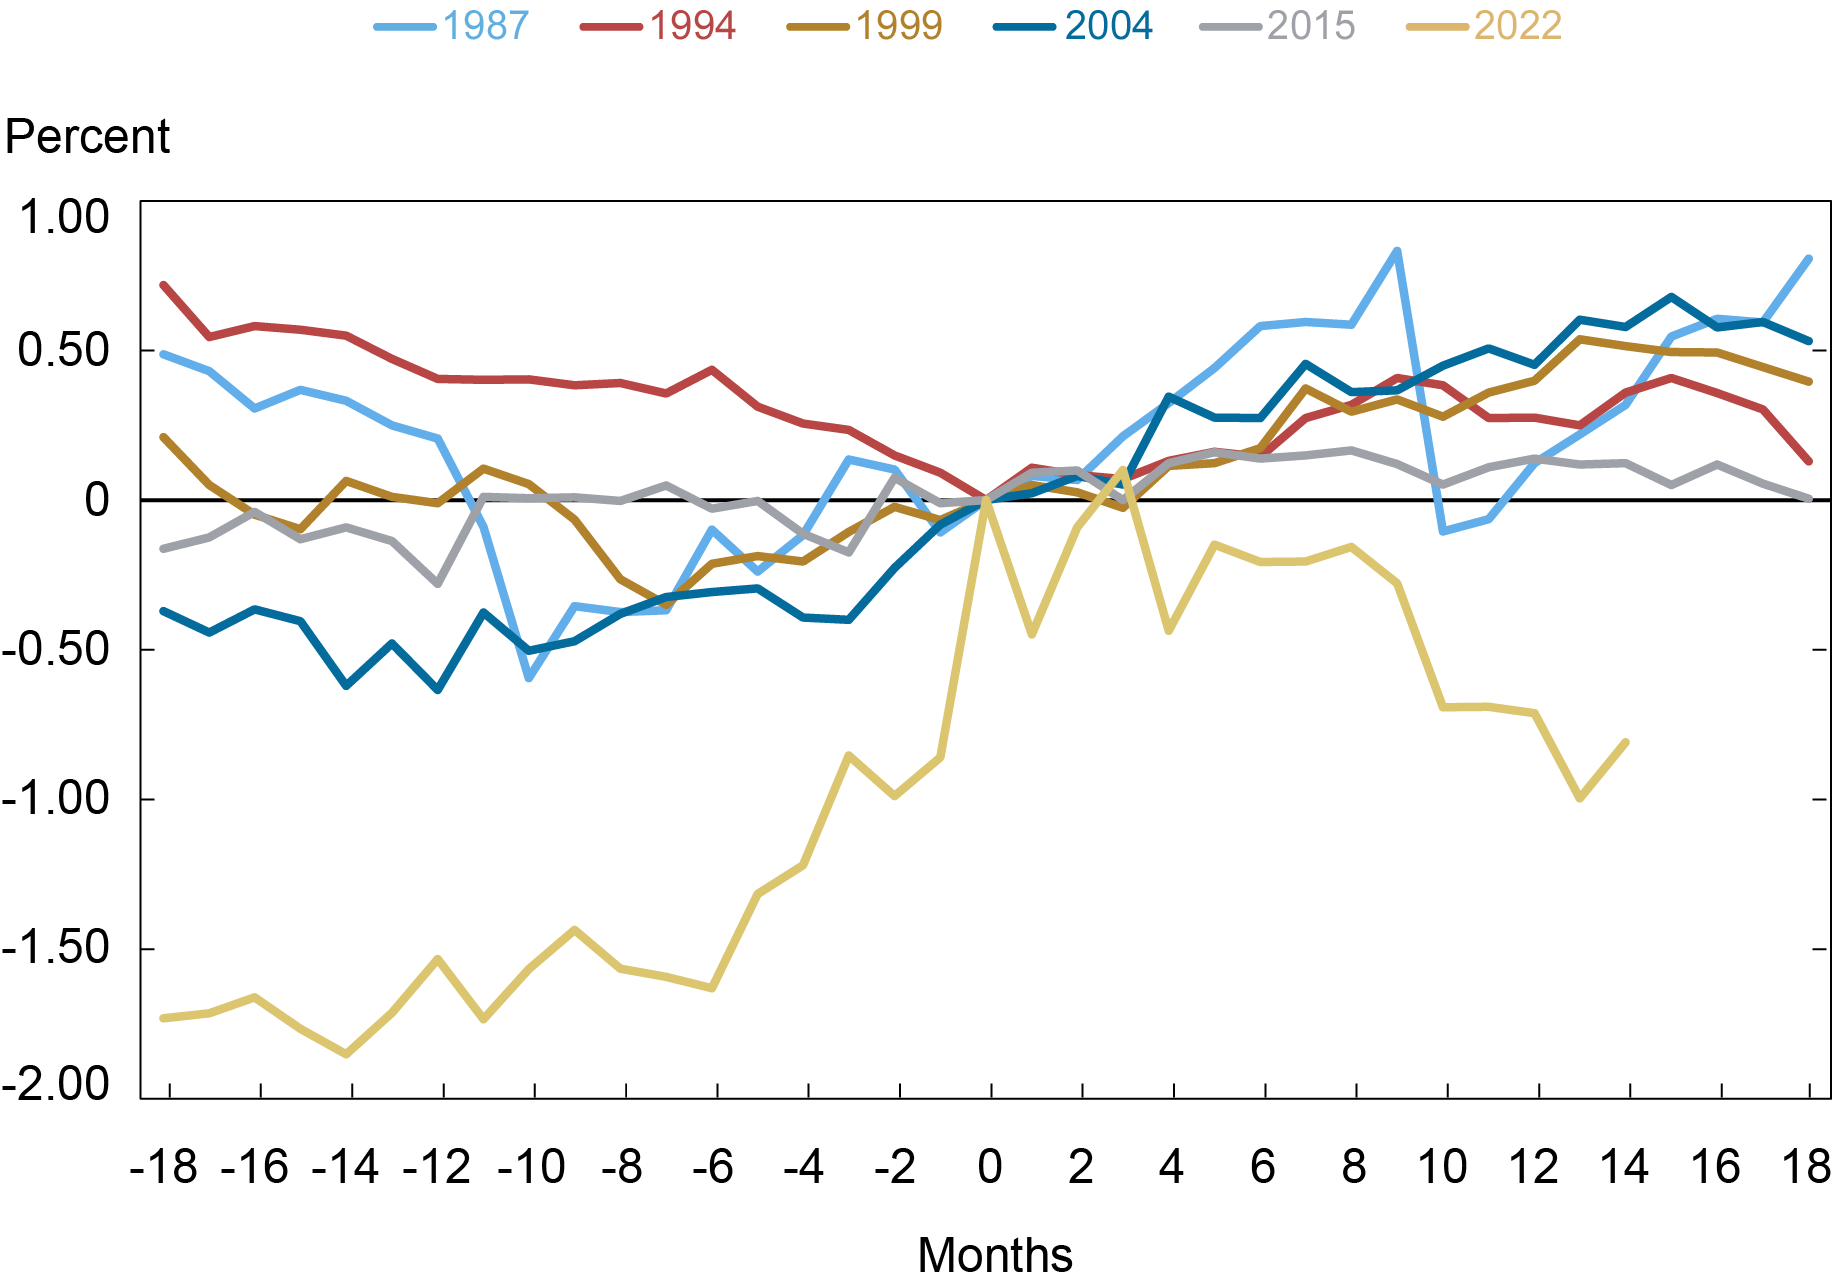
At the same time, the next chart shows that downside risks to inflation—measured as the 10th percentile of the conditional distribution of CPI inflation—rose (that is, the cumulative change in the 10th percentile became more negative) during the first phase of the current tightening cycle, unlike in the previous five cycles.
Downside Risks to Inflation Rose at the Start of the Current Tightening Cycle but Have Since Partially Reversed
Notes: The chart shows the cumulative change in the 10th percentile of the conditional distribution of the next four quarters’ average CPI inflation relative to its value in the first month of each tightening cycle. These dates correspond to January 1987, February 1994, June 1999, June 2004, December 2015, and March 2022.
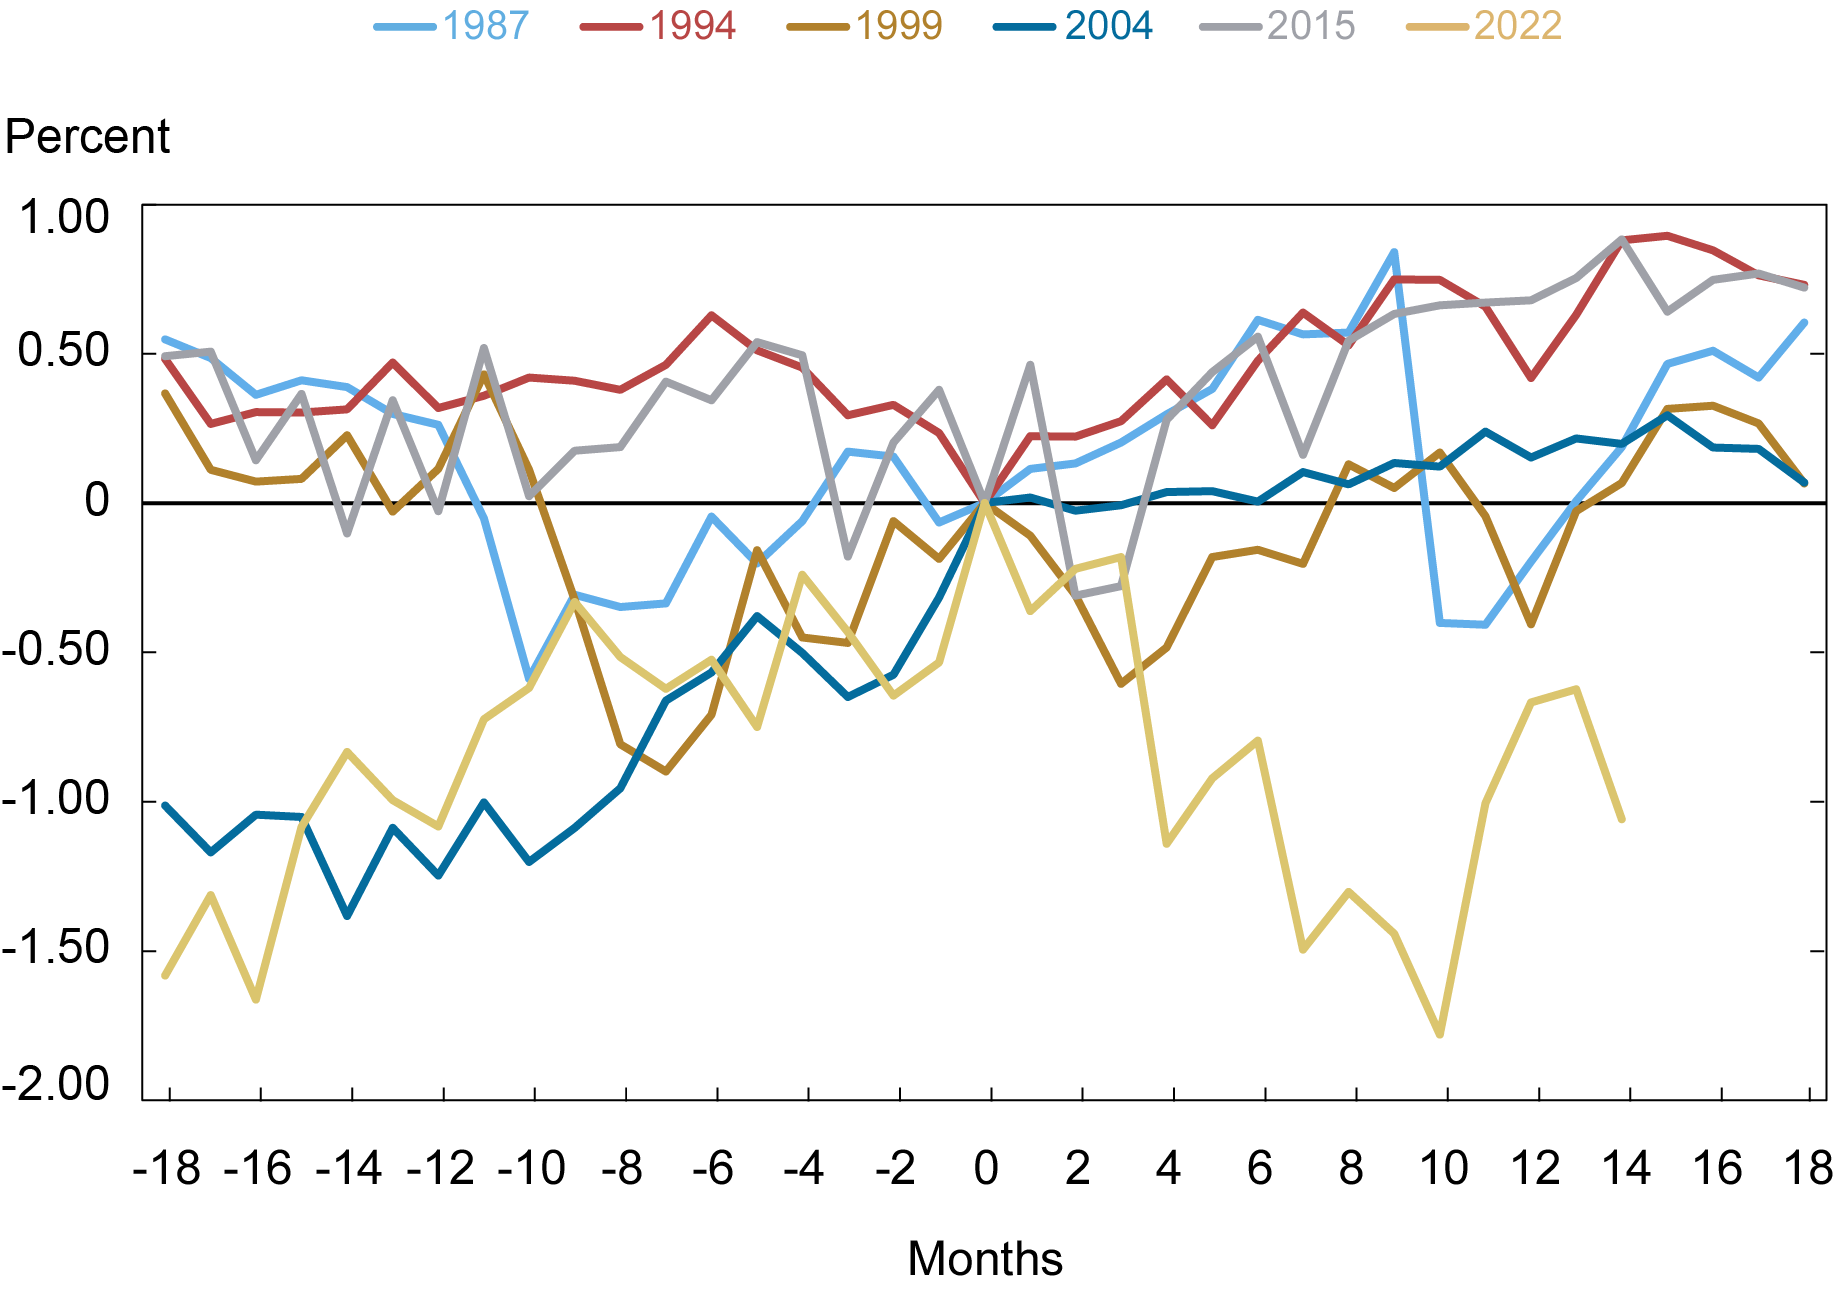
Downside risks to inflation started to abate toward the end of 2022 (around nine months after the start of the tightening cycle), so that, overall, inflation uncertainty—measured by the interquartile range (the 75th percentile less the 25th percentile)—has ameliorated over the course of this year and is now in line with past cycles, as we can see in the next spider chart.
Interquartile Range of CPI Inflation in Range with
Historical Experience
Notes: The chart shows the cumulative change in the interquartile (P75-P25) range of the conditional distribution of the next four quarters’ average CPI inflation relative to its value in the first month of each tightening cycle. These dates correspond to January 1987, February 1994, June 1999, June 2004, December 2015, and March 2022.
Downside Risks to Real Activity Have Receded over the Course of 2023 but Remain Elevated
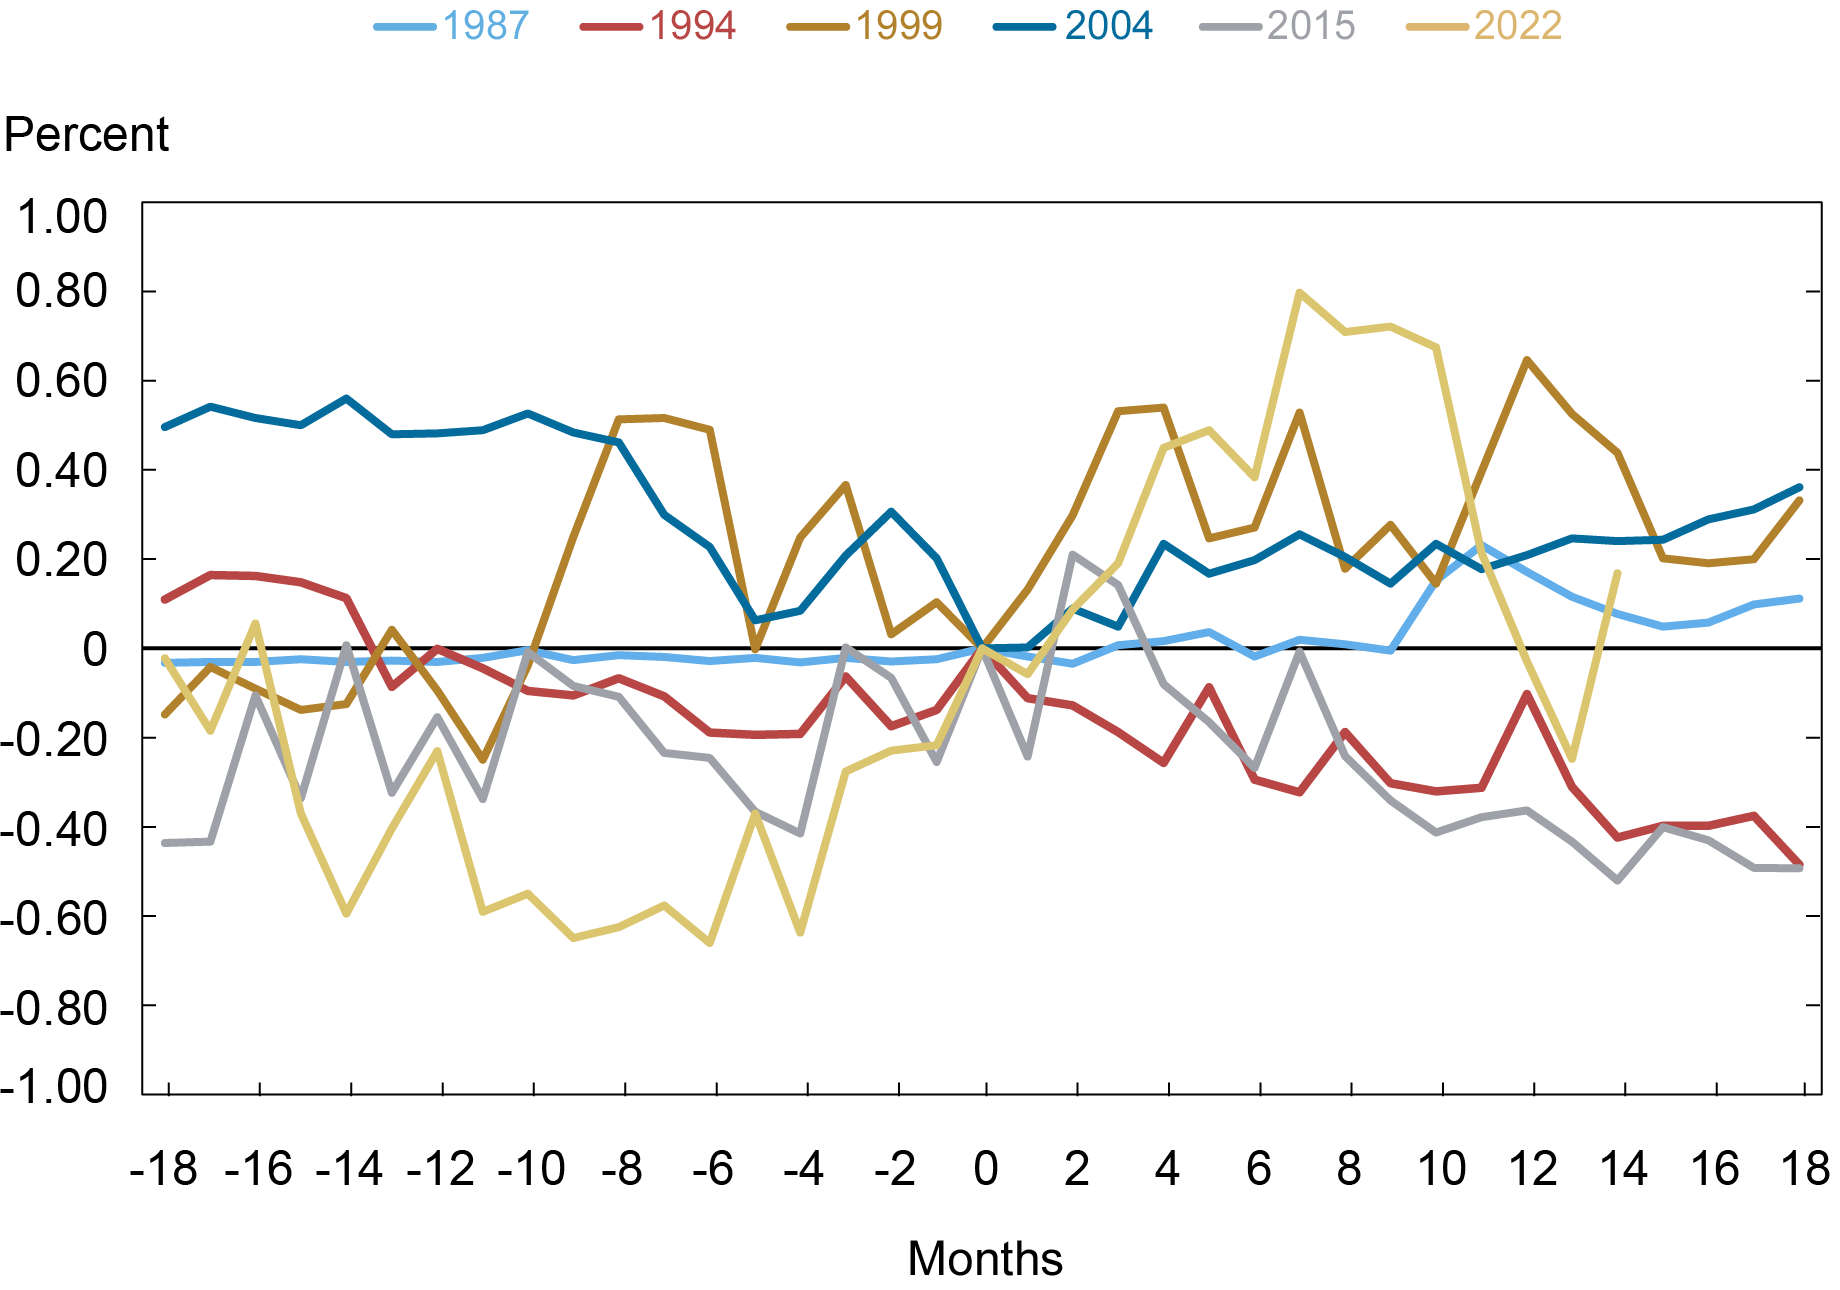
Along with moderating inflation, tighter monetary policy also tends to slow real activity. The chart below shows that, in line with the rapid pace of monetary policy tightening, downside risks—as measured by the 10th percentile—to real GDP growth increased (that is, the cumulative change in the 10th percentile became more negative) substantially over the course of 2022. Out of the previous five tightening cycle, only the 1987 cycle, which saw a substantial tightening in financial conditions even before substantial tightening in the stance of policy, exhibits similar behavior of downside risks to real GDP growth. Despite some improvements in downside risks to real GDP growth in 2023, the current 10th percentile stands at -2.2 percent.
Downside Risks to Real Activity Remain Elevated Relative
to Past Cycles…
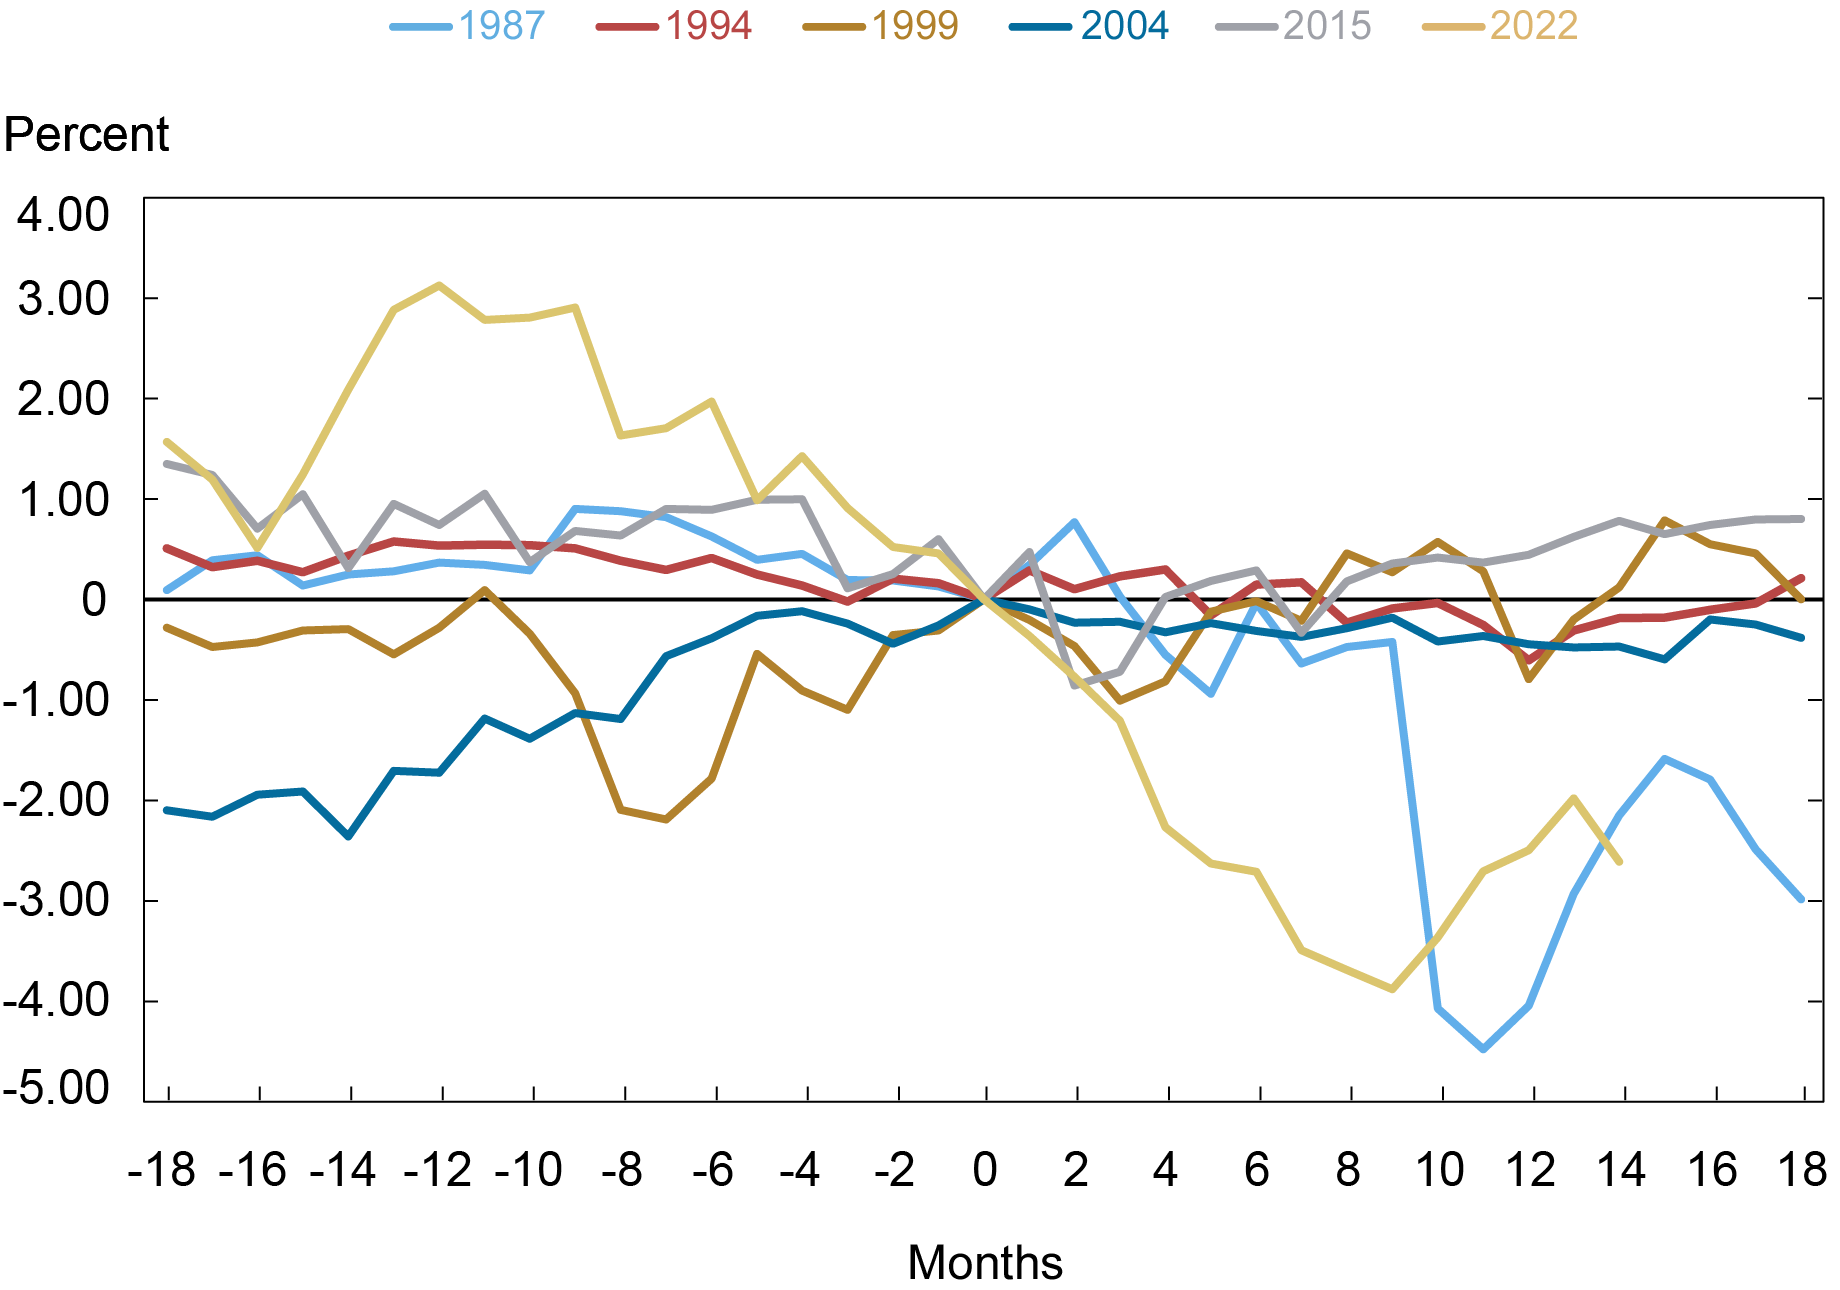
Notes: The chart shows the cumulative change in the 10th percentile of the conditional distribution of the next four quarters’ average real GDP growth relative to its value in the first month of each tightening cycle. These dates correspond to January 1987, February 1994, June 1999, June 2004, December 2015, and March 2022.
Similarly, upside risks to unemployment rose substantially over the course of 2022. The next chart shows that the probability of the unemployment rate rising by at least 100 basis points over the course of the following year has started to abate but remains elevated. This behavior is unusual relative to the previous four tightening cycles, which saw a relatively stable probability of rises in the unemployment rate during the course of tightening. As with downside risks to real GDP growth discussed above, upside risks to unemployment evolved similarly during the 1987 and current tightening cycles, highlighting that increases in risks to real activity may not be concurrent with rapid increases in the federal funds rate but rather with the overall state of financial conditions.
…as Does the Probability of a Sharp Rise in the
Unemployment Rate
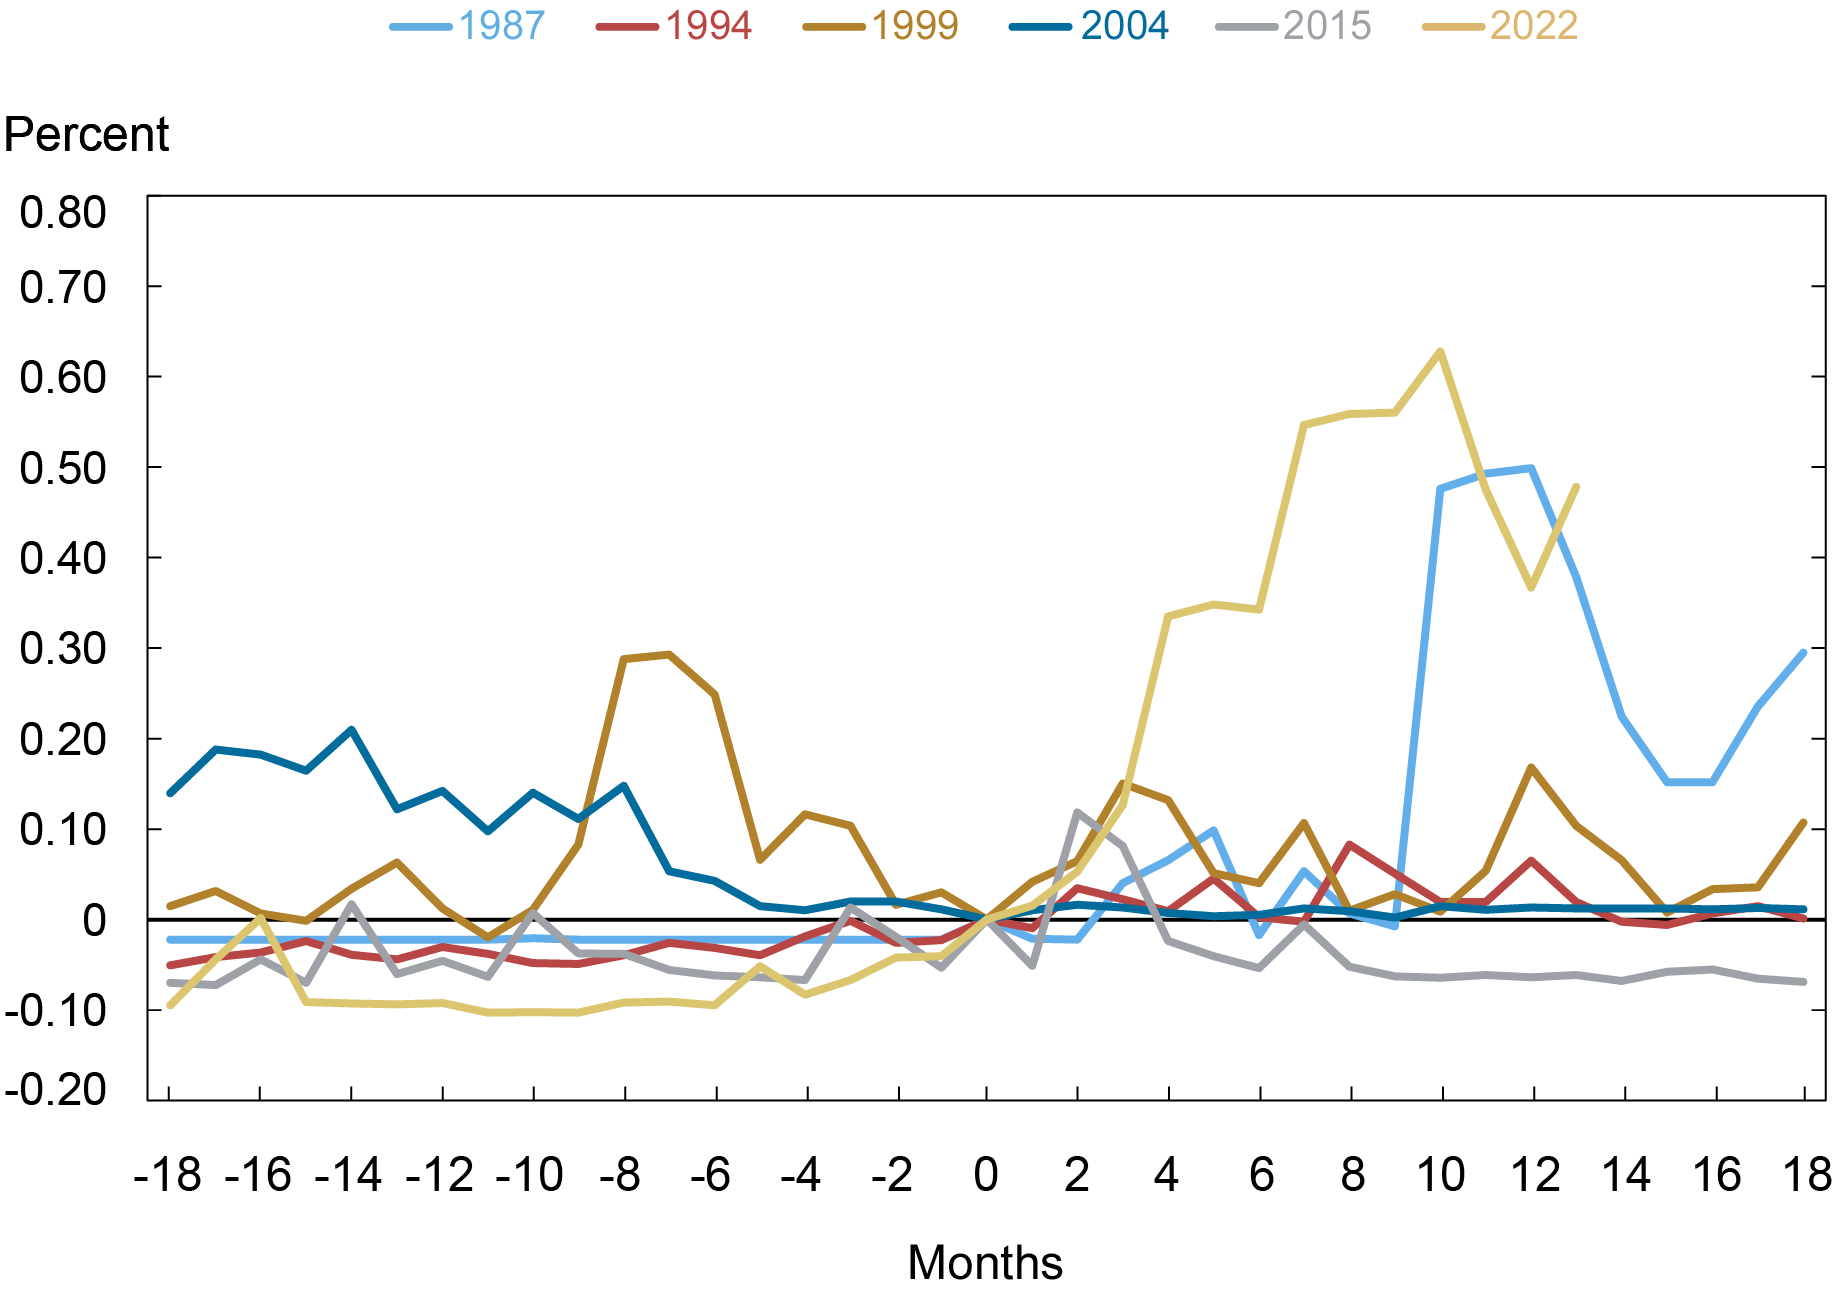
Notes: The chart shows the cumulative change in the conditional probability of at least a
100 basis point increase in the unemployment rate in four quarters’ time relative to its value in the first month of each tightening cycle. These dates correspond to January 1987, February 1994, June 1999, June 2004, December 2015, and March 2022.
Monitoring Risks Going Forward
Outlook-at-Risk provides a timely, quantitative approach to measuring risks to the future evolution of the economy. Recent banking stresses remind us that financial conditions can evolve rapidly and directly affect the likely set of outcomes for output, inflation, and the unemployment rate. The experience during the 1987 tightening cycle, which occurred against the backdrop of the 1987 stock market crash and the savings and loan crisis, suggests that financial conditions can remain tight for prolonged periods of time even absent additional shocks.
Nina Boyarchenko is the head of Macrofinance Studies in the Federal Reserve Bank of New York’s Research and Statistics Group.
Richard K. Crump is a financial research advisor in Macrofinance Studies in the Federal Reserve Bank of New York’s Research and Statistics Group.

Leonardo Elias is a financial research economist in Macrofinance Studies in the Federal Reserve Bank of New York’s Research and Statistics Group.

Ignacio Lopez Gaffney is a research analyst in the Federal Reserve Bank of New York’s Research and Statistics Group.


Disclaimer
The views expressed in this post are those of the author(s) and do not necessarily reflect the position of the Federal Reserve Bank of New York or the Federal Reserve System. Any errors or omissions are the responsibility of the author(s).
inflation
monetary
reserve
policy
central bank
monetary policy
inflationary


Argentina Is One of the Most Regulated Countries in the World
In the coming days and weeks, we can expect further, far‐reaching reform proposals that will go through the Argentine congress.

Crypto, Crude, & Crap Stocks Rally As Yield Curve Steepens, Rate-Cut Hopes Soar
Crypto, Crude, & Crap Stocks Rally As Yield Curve Steepens, Rate-Cut Hopes Soar
A weird week of macro data – strong jobless claims but…

Fed Pivot: A Blend of Confidence and Folly
Fed Pivot: Charting a New Course in Economic Strategy Dec 22, 2023 Introduction In the dynamic world of economics, the Federal Reserve, the central bank…


