Economics
Guest Contribution: “Underlying Inflation and Asymmetric Risks”
Today we present a guest post written by Danilo Leiva-León (European Central Bank), Hervé Le Bihan (Bank of France) and Matías Pacce (Bank of Spain)….

Today we present a guest post written by Danilo Leiva-León (European Central Bank), Hervé Le Bihan (Bank of France) and Matías Pacce (Bank of Spain). The views expressed in this paper are those of the authors and not necessarily those of the Bank of France, Bank of Spain, European Central Bank or the Eurosystem.
Regime Shifts in Inflation
Model-based indicators of underlying inflation have been typically built upon the assumption of linearity in the dynamics of prices. In particular, unobserved component models generally assume that the dynamics of underlying inflation follows a random walk, so that underlying inflation can only exhibit smooth changes over time. The recent abrupt surge in energy and raw material prices, and the subsequent rapid pass-through to other items in the consumption basket, however, challenge that assumption. In addition, several works emphasize the importance of accounting for nonlinearities and state-dependence when modelling inflation (e.g. Ascari and Haber (2022), Klenow and Kryvtsov (2008), Cavallo, Lippi and Miyahara (2023)).
Against this backdrop, Le Bihan, Leiva-León and Pacce (2023) rely on a multivariate regime-switching framework to estimate the persistent component of inflation at the disaggregated level.[1] Unlike previous related approaches in the literature, each persistent component of interest is assumed to exhibit shifts between high- and low-inflation regimes of unique magnitudes.[2] Figure 1 displays the estimated persistent component of euro area inflation at the disaggregated level, pointing to a substantial amount of heterogeneity both over time and across categories. The estimates show that the proposed framework is flexible enough to adapt to the wide variety of inflationary dynamics embedded in the different types of goods and services.
A Nonlinear Measure of Underlying Inflation
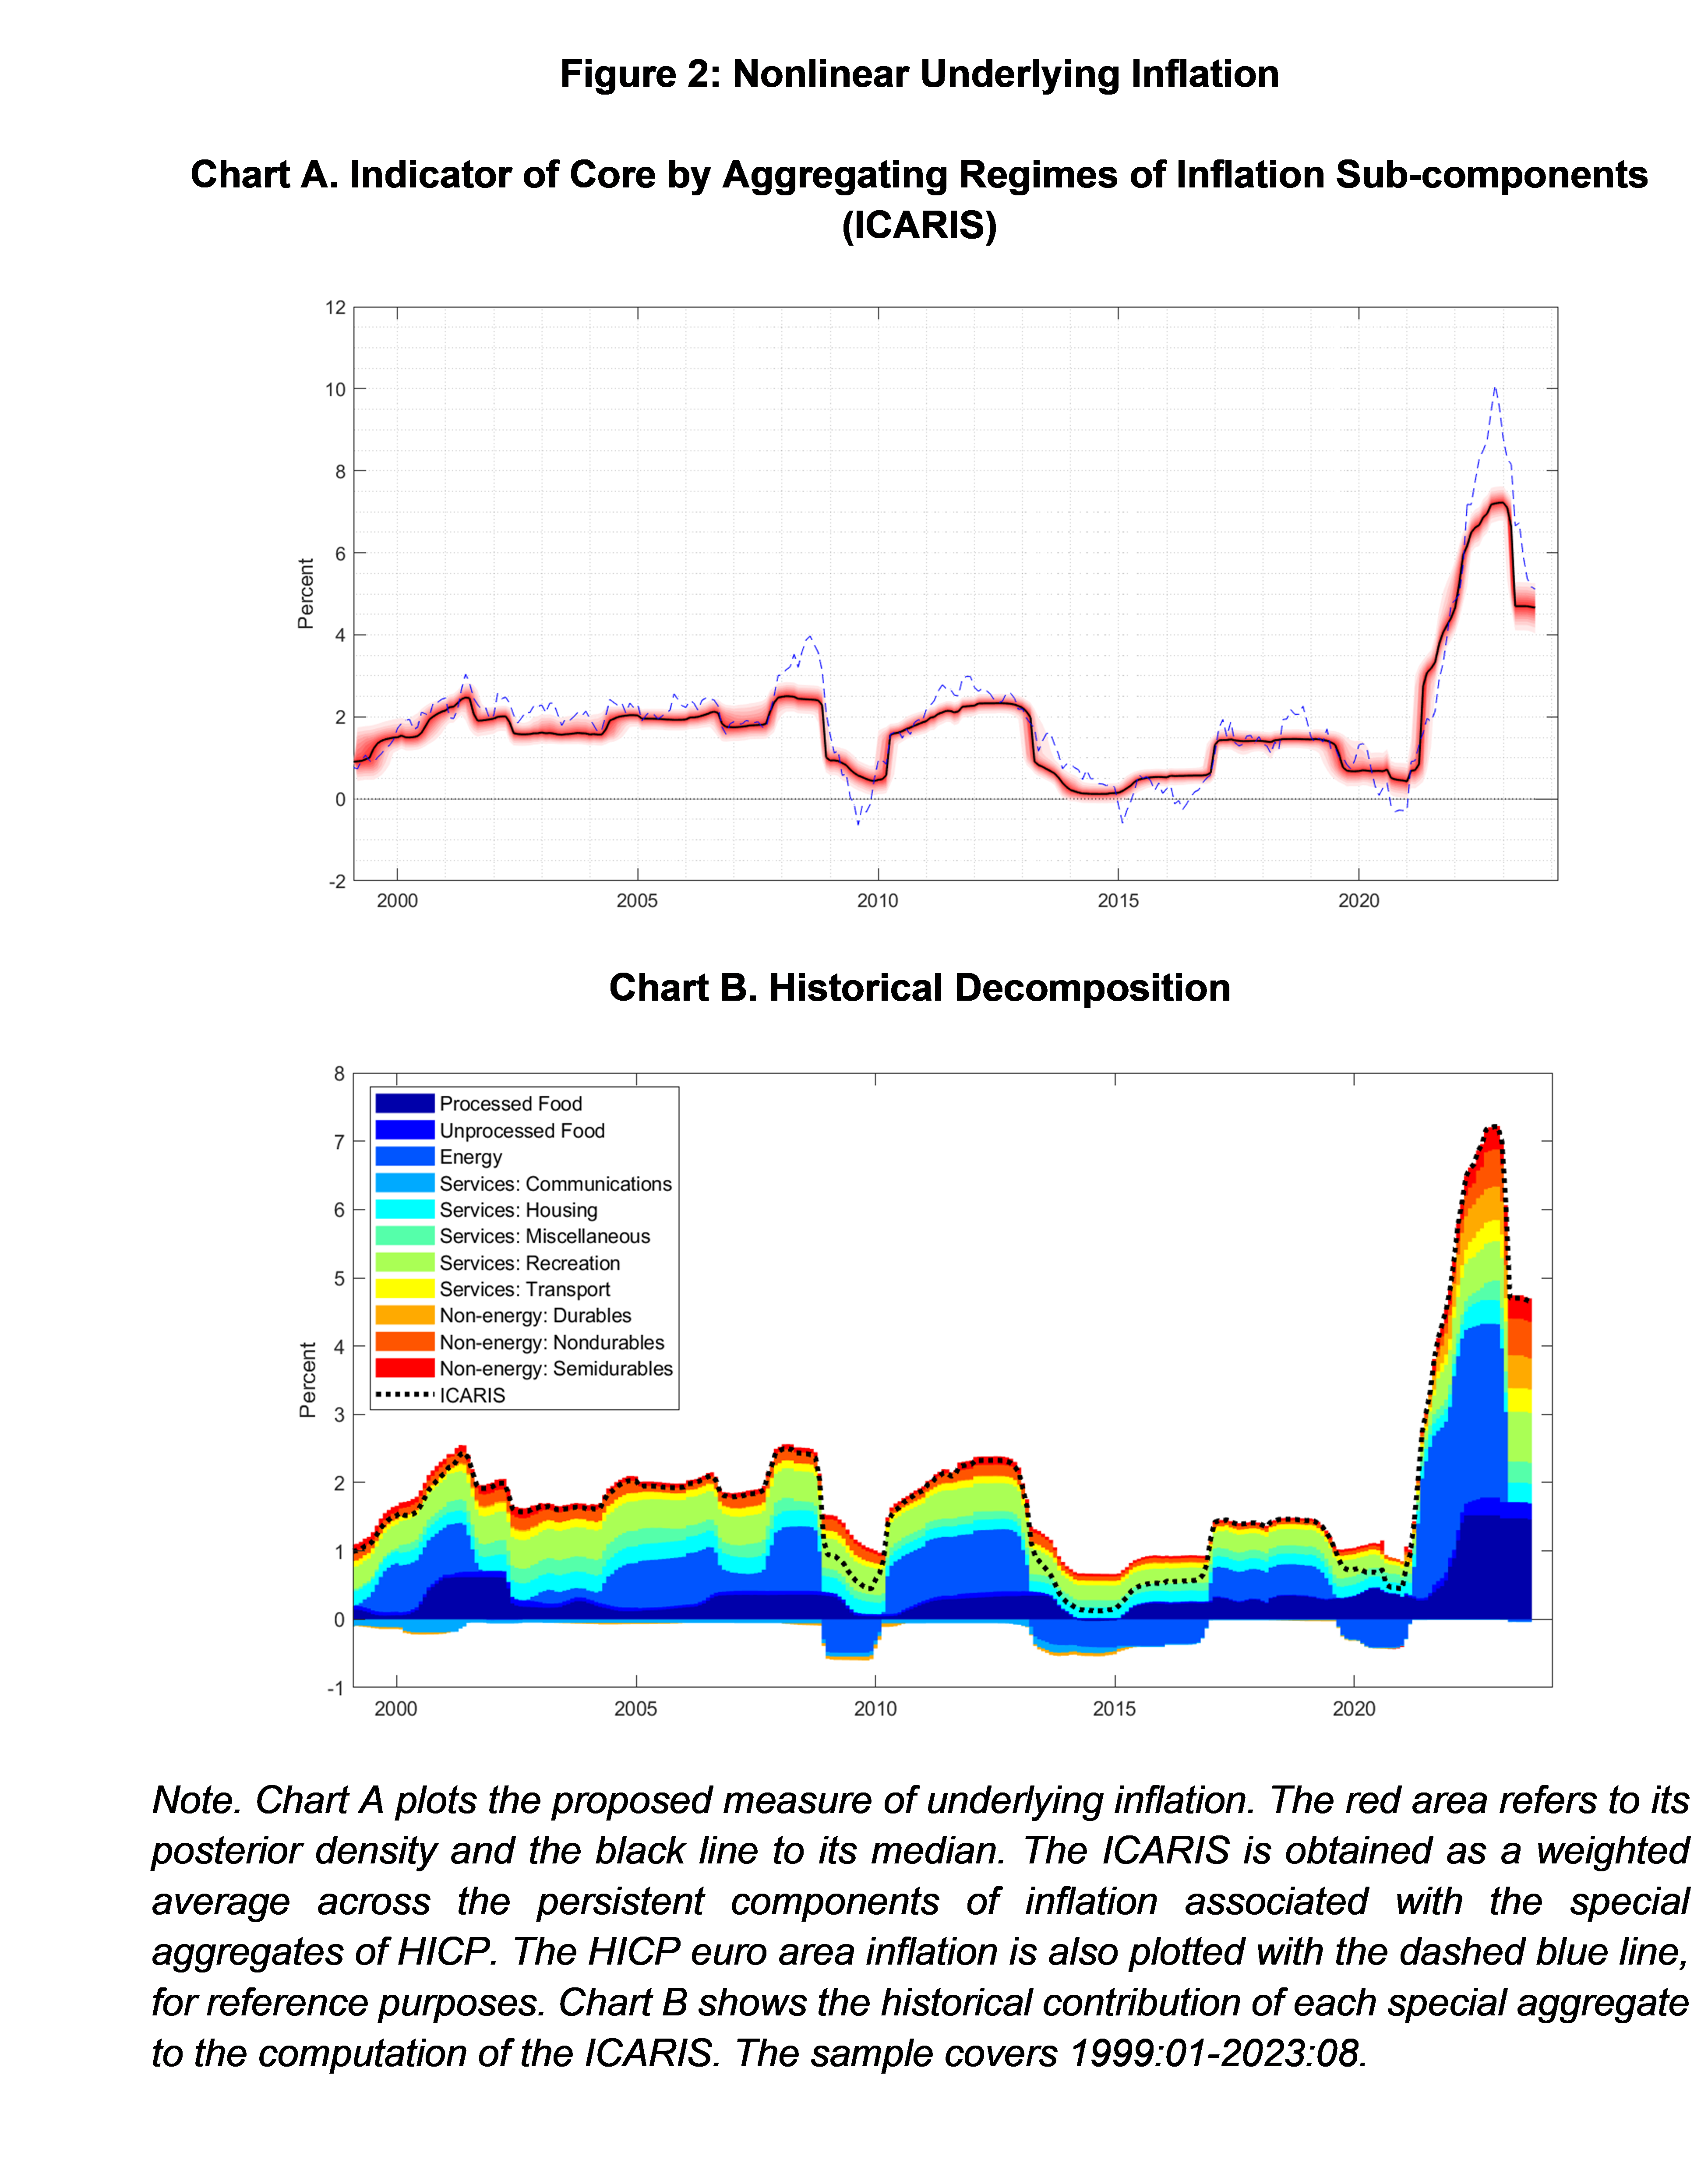
Consistent with underlying inflation being defined as the persistent component in overall inflation, by using the weights to construct the HICP, we summarize the persistent components associated with the various sub-aggregates into a single measure that constitutes our proposed nonlinear measure of underlying inflation. The resulting indicator is labeled “ICARIS”, that stands for Indicator of Core by Aggregating Regimes of Inflation Sub-components. Chart A of Figure 2 plots our measure of core inflation for the period 1999:01-2023:08. The ICARIS is characterized by a strong persistence. This is an appealing feature as this underlying inflation measure is not influenced by erratic movements often displayed in the inflation rates of special aggregates. Despite its persistence, the ICARIS is able to rapidly adjust to new inflation environments. For example, this is the case when the euro area transitioned to a sustained period of low inflation over the course of 2013.
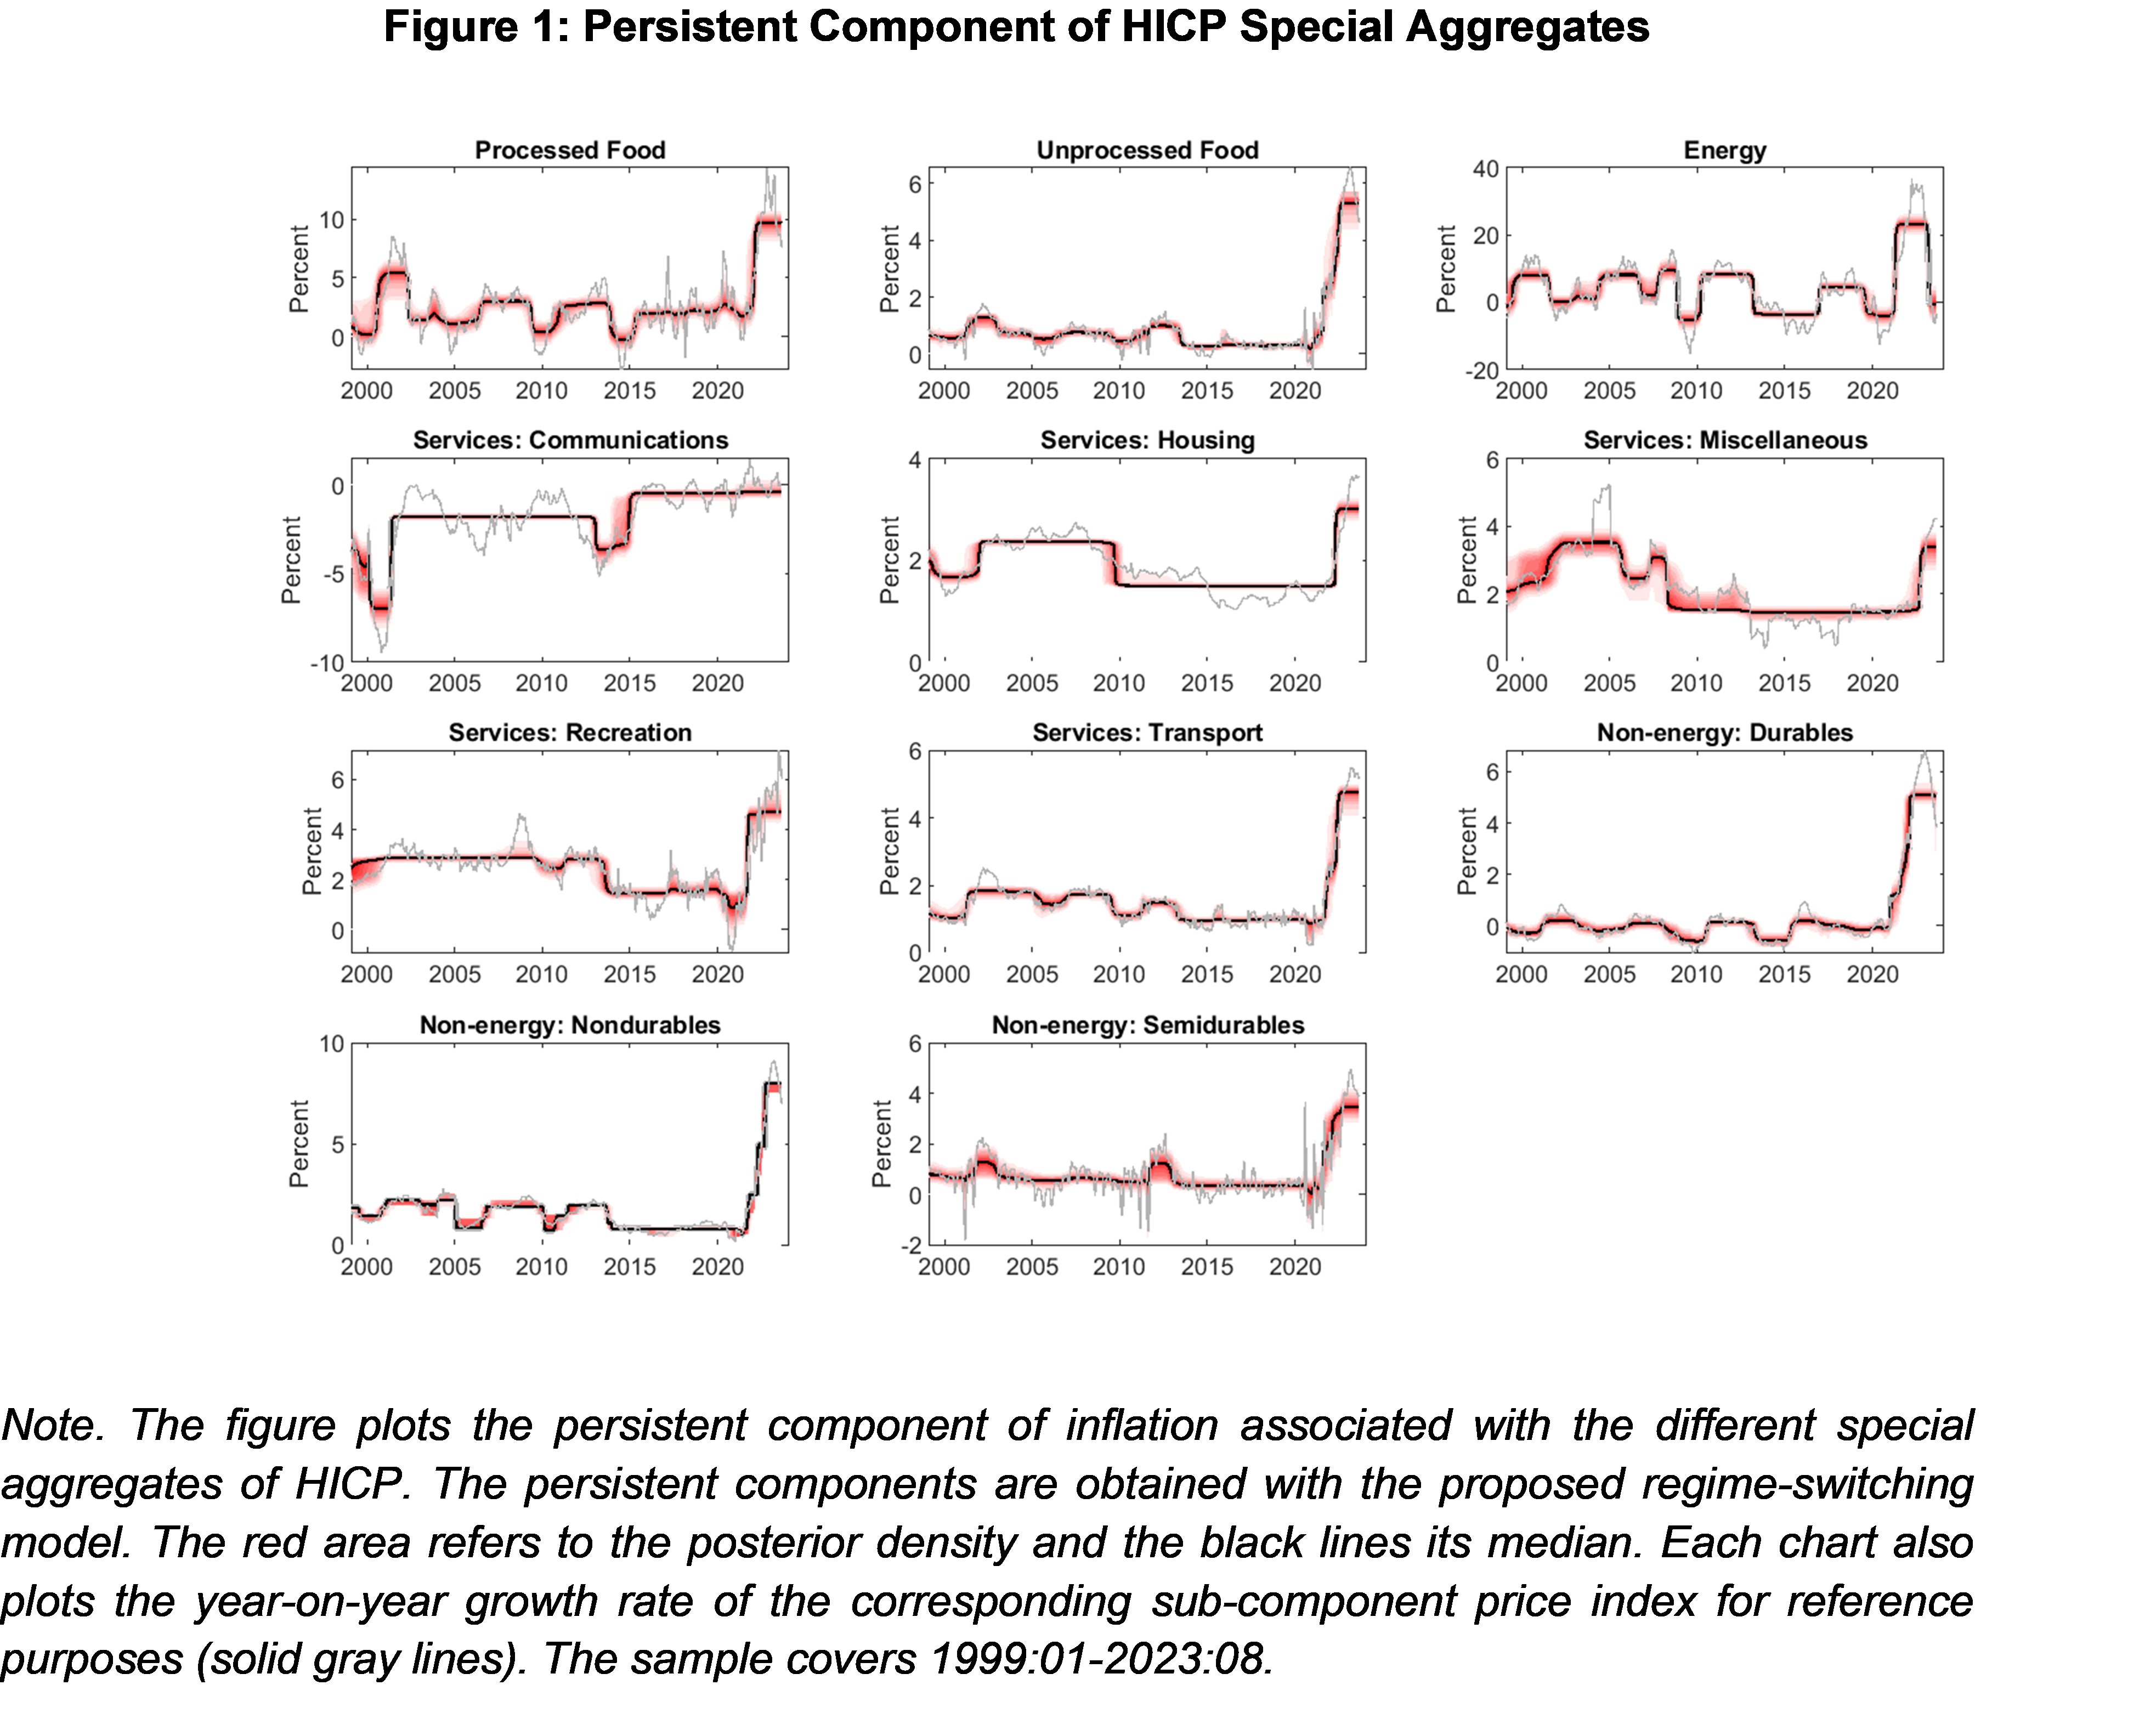
When focusing on the post-pandemic period, the ICARIS suggests an abrupt and unprecedented jump in euro area underlying inflation, starting in early 2021, reaching its peak in December 2022 and rapidly falling until March 2023. Since then, underlying inflation has remained almost constant until the end of the sample, August 2023, displaying values close to 4.6%. This suggests, as also confirmed by examination of other indicators, that underlying inflation has passed a peak, even though it is still at level well above the ECB objective.[3] Chart B of Figure 2 plots the historical contribution of each HICP sub-component to the ICARIS, showing the prominent role of energy prices in driving underlying inflation between early 2021 and March 2023. It also shows that although energy prices are currently not contributing significantly to underlying inflation, the other sub-components of HICP ―in particular, food inflation― are still subject to persistently high inflationary pressures, as can be seen in Figure 1 at the end of the sample.
Risk Assessment
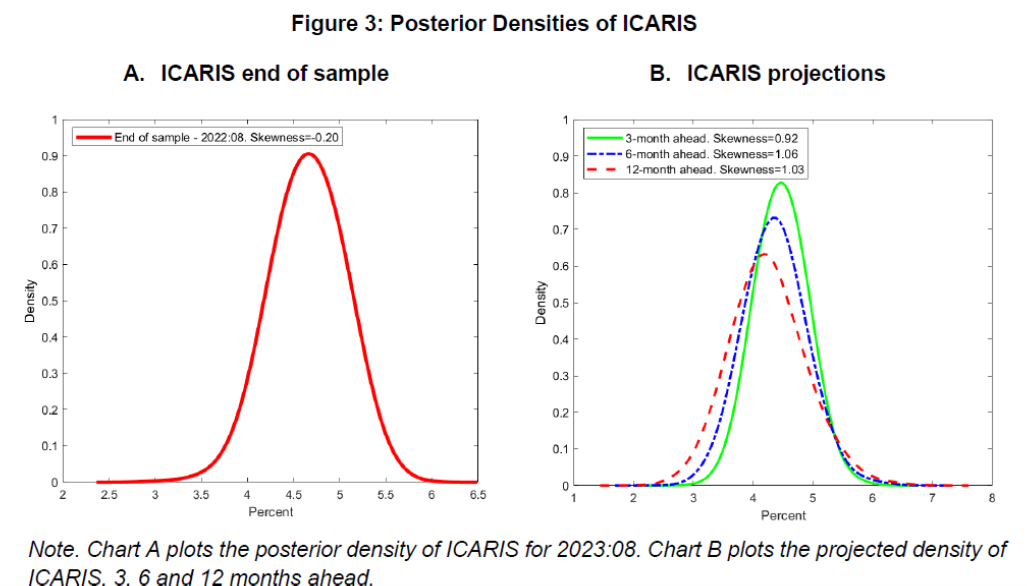
The ICARIS can be also used to measure asymmetric tail risks associated with future underlying inflation. Such asymmetry results from the induced non-linearity in our model. This is a feature that could be of high relevance for policy in projection exercises, or from the point of view of a “risk management” perspective, particularly, during periods of high uncertainty. Chart A of Figure 3 plots the posterior density of ICARIS for August 2023 that exhibits a skewness of -0.20, suggesting mild downside “risks” associated with current underlying inflation. Instead, Chart B of Figure 3 shows the densities of the projected ICARIS 3, 6 and 12 months ahead, taking September 2023 as the beginning of the projection. The sequence of densities suggests that the expected path of underlying inflation for the coming months is associated with a slight downward trend, however, risks significantly point to the upside. This message can be inferred from the movement towards the left of the densities over the projection horizon along with their positive associated skewness.[4]
References
Ascari, G. and T. Haber (2022). “Non-Linearities, State-Dependent Prices and the Transmission Mechanism of Monetary Policy,” The Economic Journal, 132(641), 37–57.
Cavallo, A, Lippi F, and Miyahara F. (2023) “Large Shocks Travel Fast, NBER Working Paper 31659”
Klenow, P. and O. Kryvtsov (2008). “State-dependent or time-dependent pricing: does it matter for recent U.S. inflation?,” The Quarterly Journal of Economics, 123(3), 863–904.
Le Bihan, H., D. Leiva-León and M. Pacce (2023). “Underlying Inflation and Asymmetric Risks,” Banco de España Working Paper N.2319.
Leiva-León, D., G. Pérez-Quirós and E. Rots (2023). “Real-Time Weakness of the Global Economy,” Journal of Applied Econometrics, Forthcoming.
[1] Monthly HICP inflation data are broken down by “type of product” into 11 specific categories, which are related to some “special aggregates” indices, or sub-compoents, of inflation published by EUROSTAT, and typically used by the ECB for analytical purposes.
[2] The proposed approach ―built upon the work by Leiva-León, Pérez-Quirós and Rots (2023)― also allows information on real activity ―proxied by the euro area Industrial Production Index― to inform about the transitions between inflation regimes.
[3] The inflation excluding food and energy, or core inflation, reached 5.3% in August.
[4] As a general rule of thumb, if the skewness of a given distribution is between -0.5 and 0.5, it could be considered as approximately symmetric.
Instead, if the skewness is higher (lower) than 0.5 (-0.5), the distribution can be considered asymmetric.
This post written by Danilo Leiva-León, Hervé Le Bihan and Matías Pacce.
inflation
monetary
policy
central bank
monetary policy
inflationary


Argentina Is One of the Most Regulated Countries in the World
In the coming days and weeks, we can expect further, far‐reaching reform proposals that will go through the Argentine congress.

Crypto, Crude, & Crap Stocks Rally As Yield Curve Steepens, Rate-Cut Hopes Soar
Crypto, Crude, & Crap Stocks Rally As Yield Curve Steepens, Rate-Cut Hopes Soar
A weird week of macro data – strong jobless claims but…

Fed Pivot: A Blend of Confidence and Folly
Fed Pivot: Charting a New Course in Economic Strategy Dec 22, 2023 Introduction In the dynamic world of economics, the Federal Reserve, the central bank…
