Economics
Gold price forms doji candle as the DXY index drifts higher
Gold price continued its bullish rally this week as it came close to its highest level on record. The XAG/USD pair rose to a high of 2,033, which was a…

Gold price continued its bullish rally this week as it came close to its highest level on record. The XAG/USD pair rose to a high of 2,033, which was a few points below its all-time high of 2,071. It has jumped by more than 24% from its lowest point in November last year.
NFP data ahead
Gold price rally has coincided with the US dollar sell-off. After peaking at a 2-decade high of $115 in 2022, the US dollar index has plunged to $101 this week. This decline happened as investors remained convinced that the Federal Reserve will pivot in the coming months considering that the American economy was slowing.
The case of a slowing American economy was evidenced this week when the US published weak economic numbers. On Monday, data by the Institute of Supply Management (ISM) showed that the manufacturing sector continued contracting in March.
Another report by the same institute showed that the services PMI also declined from 54 to 51 in February. While this was above the expansionary area of 50, the decline signaled that the most important sector in the US was slowing.
Meanwhile, another report by ADP on Friday showed that private payrolls dropped to 148k in March, the lowest figure in months. A day before, the US published weak JOLTs jobs report that showed that the number of vacancies in the country dropped below 10 million for the first time since 2021.
Therefore, since the Fed has vowed to be data-dependent, there is a likelihood that the bank will start pivoting if more numbers come out like this. Therefore, the official non-farm payroll (NFP) data scheduled for Friday will be important. Economists expect that the economy added 268k jobs in March while the unemployment rate remained at 3.6.
Gold price rally has also coincided with the strong performance of American bonds. The yield of the 5-year bond yield dropped to 3.78% while the 10-year dropped to 3.30%.
Gold price forecast
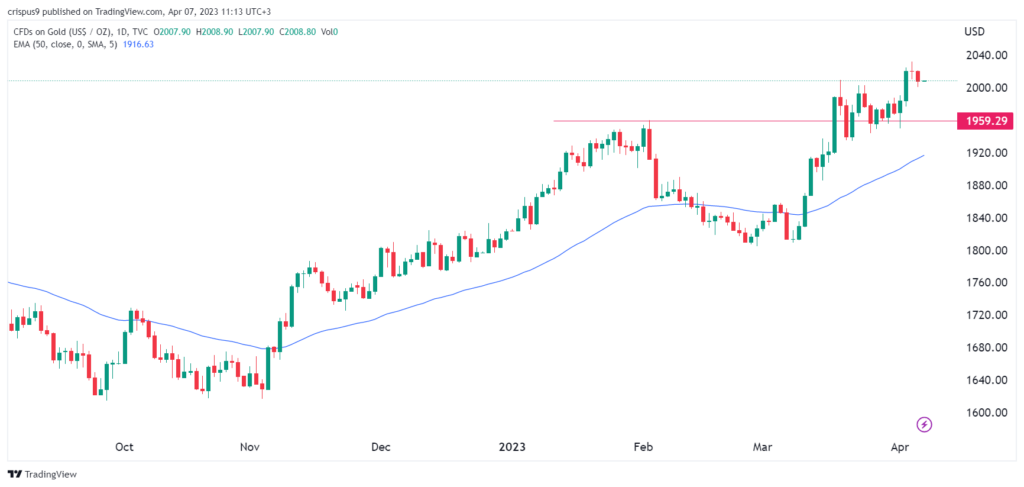
A closer look at the daily chart shows that gold price has formed a small doji candlestick pattern. This pattern is characterized by a tiny body and long lower and upper shadows. It is usually one of the most accurate candlestick patterns.
Gold remains above the 25-day and 50-day moving averages and the key level at $1,959, the highest level on February 2nd. Therefore, I suspect that the XAU/USD pair will pull back and retest the support at 1,959 as it continues its journey to its all-time high.
The post Gold price forms doji candle as the DXY index drifts higher appeared first on Invezz.


Argentina Is One of the Most Regulated Countries in the World
In the coming days and weeks, we can expect further, far‐reaching reform proposals that will go through the Argentine congress.

Crypto, Crude, & Crap Stocks Rally As Yield Curve Steepens, Rate-Cut Hopes Soar
Crypto, Crude, & Crap Stocks Rally As Yield Curve Steepens, Rate-Cut Hopes Soar
A weird week of macro data – strong jobless claims but…

Fed Pivot: A Blend of Confidence and Folly
Fed Pivot: Charting a New Course in Economic Strategy Dec 22, 2023 Introduction In the dynamic world of economics, the Federal Reserve, the central bank…


