Economics
Global Markets Recovered Some Of February’s Losses Last Week
Repair and recovery was on display last week as the major asset classes clawed back some of the across-the-board losses in February. All the primary categories…

Repair and recovery was on display last week as the major asset classes clawed back some of the across-the-board losses in February.
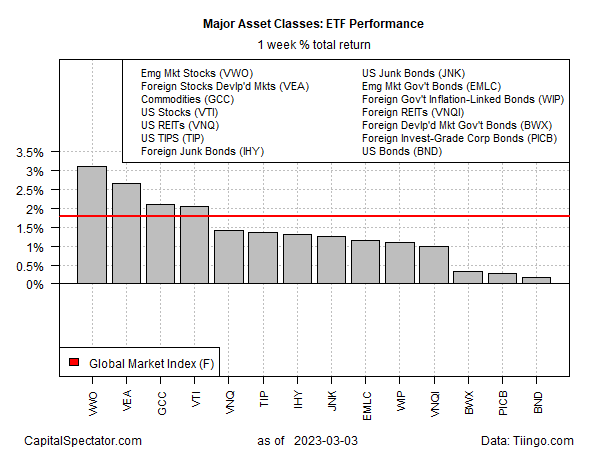
All the primary categories of global risk assets pushed higher in the first week of trading for March, based on a set of ETFs. Stocks in emerging markets led the rally through Friday’s close (Mar. 3)
Vanguard Emerging Markets Stock Index Fund (VWO) surged 3.1%, marking the ETF’s first weekly gain since January. Despite the rally, it’s unclear if VWO’s long-running slide has finally bottomed. The next several weeks could be decisive for deciding if the fund is in a trading range or laying the foundation for a new bull run.

Gains prevailed across all the major asset classes. Even the embattled US bond market managed to eke out a win. But with Federal Reserve officials continuing to talk up the odds for more rate hikes, the fractional gain in Vanguard Total Bond Market Index Fund (BND) looks like noise.
On Friday the Federal Reserve submitted its semi-annual Monetary Policy Report to Congress and advised that more interest rate increases are required to achieve price stability. The central bank “anticipates that ongoing increases in the target range will be appropriate.”
The tailwind for markets last week lifted the Global Market Index (GMI.F), which rose 1.8%. This unmanaged benchmark holds all the major asset classes (except cash) in market-value weights via ETFs and represents a competitive measure for multi-asset-class-portfolio strategies.
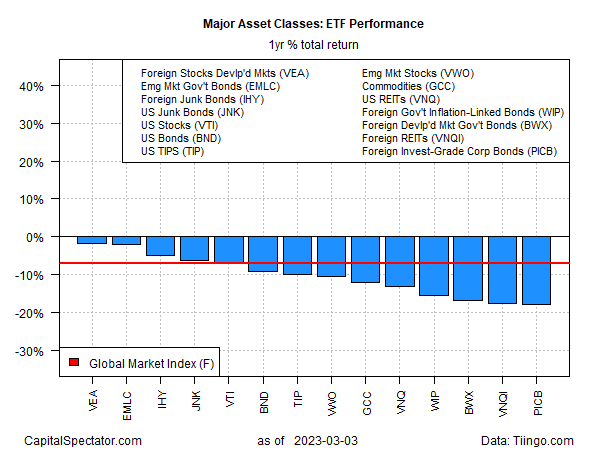
Despite the latest rally in markets, all the major asset classes continue to post losses for the trailing one-year trend. Shares in developed markets ex-US (VEA) are suffering the least, with a modest 1.9% decline at Friday’s close vs. the year-ago price after factoring in distributions.
The biggest one-year loser: corporate bonds ex-US (PICB) with an 18.0% one-year decline.
GMI.F is also in the red via a 7.2% loss over the past 12 months.
Comparing the major asset classes through a drawdown lens continues to show relatively steep declines from previous peaks for markets around the world. The softest drawdown at the end of last week: US junk bonds (JNK), which ended the week with a 9.9% peak-to-trough loss.

Learn To Use R For Portfolio Analysis
Quantitative Investment Portfolio Analytics In R:
An Introduction To R For Modeling Portfolio Risk and Return
By James Picerno
monetary
markets
reserve
policy
central bank
monetary policy


Argentina Is One of the Most Regulated Countries in the World
In the coming days and weeks, we can expect further, far‐reaching reform proposals that will go through the Argentine congress.

Crypto, Crude, & Crap Stocks Rally As Yield Curve Steepens, Rate-Cut Hopes Soar
Crypto, Crude, & Crap Stocks Rally As Yield Curve Steepens, Rate-Cut Hopes Soar
A weird week of macro data – strong jobless claims but…

Fed Pivot: A Blend of Confidence and Folly
Fed Pivot: Charting a New Course in Economic Strategy Dec 22, 2023 Introduction In the dynamic world of economics, the Federal Reserve, the central bank…
