Economics
From COVID and back again: An Aussie housing tale
Hard to believe, but it’s been almost three years since the World Health Organisation (WHO) declared COVID-19 a global pandemic, … Read More
The post…
Hard to believe, but it’s been almost three years since the World Health Organisation (WHO) declared COVID-19 a global pandemic, and all hell broke loose across local and global markets. Not long now and it’ll be three years since then US President Donald Trump is going to have his people look into injecting everyone with UV rays.
Ah. Happy days.
Governments everywhere turned on the stimulation taps in a glorious knee jerk flood of capital which – here at home – did some pretty amazing things to our housing market. We might’ve been locked down and thinking of stabbing our loved ones in the eye, but my godness, we were breaking property records while we were doing it…
So here’s the 10 places Aussie prices have really gone nuts (since COVID came)
The other property stuff you should know
Now we’re back near boring old pre-pandemic norms, er, property wise.
There’s a few metrics which are very close to reset, while – according to CoreLogic, other parts of the housing market have been changed forever. Like Frodo was when he destroyed the One Ring in the Fires of Mordor and retuned to find Bag End under the third flight path.
Now. I’m going a little off-piste here to begin… I don’t usually recommend further reading but it won’t hurt having a complete stickybeak at the entireCoreLogic report which I’m about to summarise in typically dynamic and snappy fashion.
But, I say let’s live a little – I’m going to steal a link and ( ah here it is, but don’t press it yet – I’m still talking!).
Hand carved from the collapsed but still screaming hot mess that is Australia’s combined capital city dwelling values, CoreLogic’s Evil Queen of Numbers (and Head of Residential Research) Eliza Owen has gone and taken all the gazillion meaningless data points since COVID-19 and – I’ll give her this – turned it into a long but quite digestable narrative which makes sense and could actually help people who’re trying to figure out Aussie property.
So read it all if you must – Time Magazine called it ‘another brutally researched and incredibly sensible Aussie housing wrap from the author of ‘Oh No! It’s a Housing Market Collapse, haha, just kidding… or am I…? ‘
I feel that what it lacks in adolescent humour, it makes up for in data, logic and facts. And pics! The pics are always great. I have some below.
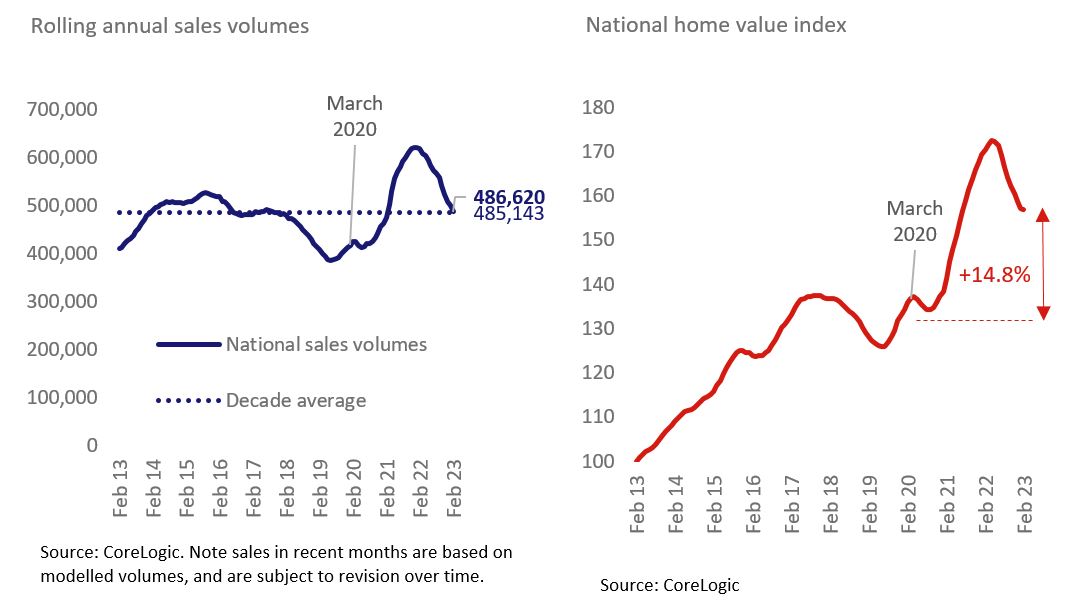
1. National housing values: up 14.8% Vs March 2020
-
National dwelling values rose 28.6% from September 2020 to April 2022
-
But a record rise in interest rates soon turned all this to dust and into the largest and fastest downswing we’ve ever had
-
From April 2022 through to the end of February, values crashed -9.1%
-
Annual sales volumes are down -21.5% from a peak in December
-
Despite the recent volatility, home values remain 14.8% higher overall

-
In recent weeks, Eliza’s seen signs in the numbers of a stabilising market
-
“But it may be too soon to call the bottom of the market amid ongoing interest rate rises…”
-
She says it’s likely that once interest rate hikes a paused, the movement in sales volumes and home values “may become less extreme”
2. Our property market remains a very ‘mixed bag’
-
In the past three years, Adelaide houses have come out on top across the capital cities, with values sitting 43.7% higher than at the end of March 2020
-
This is the equivalent of a $211,097 increase on the median house value across the city
-
Much, much stronger than the equivalent median house value gain in Sydney (which has risen the equivalent of $119,830)
-
While Melbourne house values have actually seen a decline since March 2020, down the equivalent of -$1,009 at the median house value level
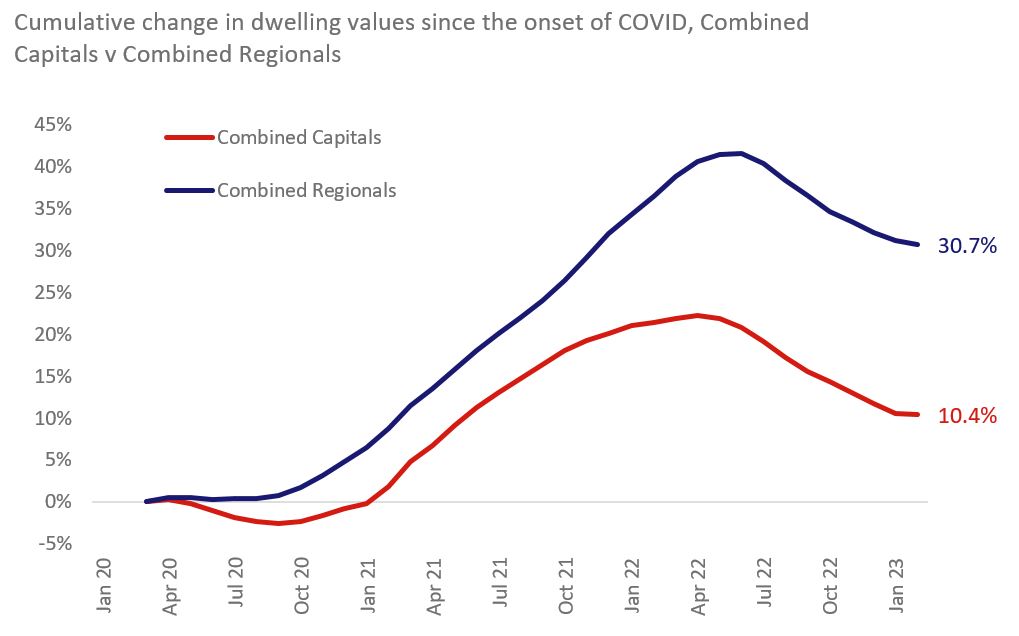
3. Regional values are still pretty high, net migration could return to pre-COVID flow
-
Across the combined regional dwelling market, values remain 30.7% higher in than at the onset of COVID-19, compared with values sitting 10.4% higher across the combined capitals.
-
Eliza: “While ABS migration data is only reported to March 2021, joint research from CBA and the RAI shows the ‘regional movers index’ declining from pandemic highs. According to the research, net migration from capitals to regions is still higher on average than pre-COVID levels, but has been trending down for the past two years.”
-
While migration flows away from regional Australia may help to ease pressure on demand for some markets, it is clear that regional markets have retained the most value since the onset of the pandemic.
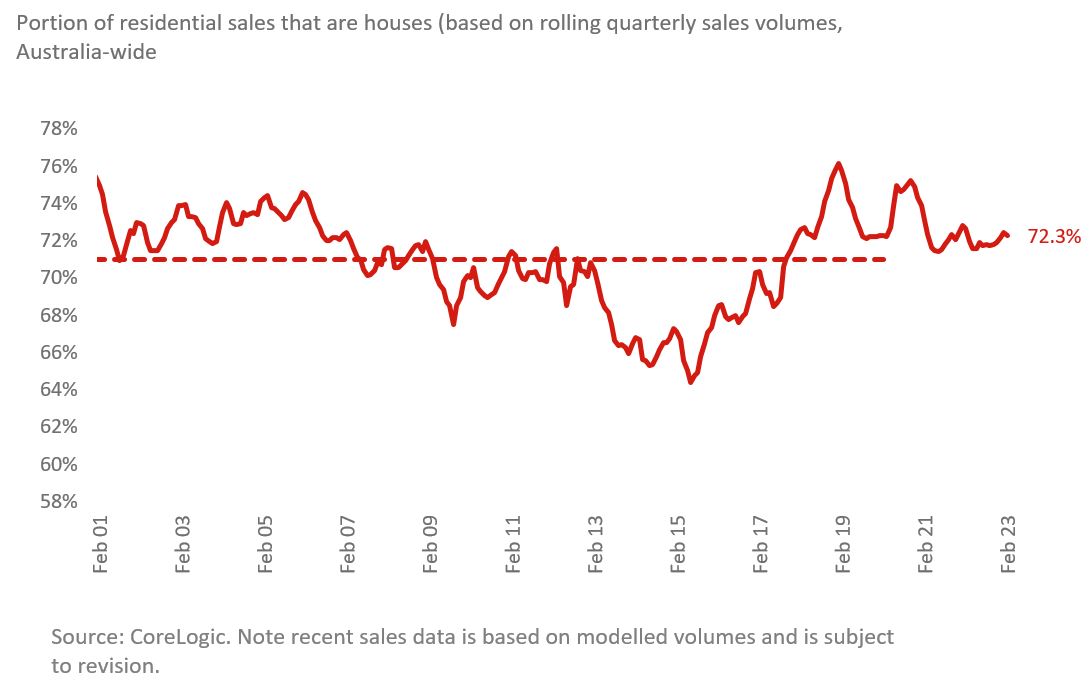
4. The preference for houses over units is easing
-
Through the worst of the lockdowns, purchase preferences seemed geared towards houses.
-
Likely a combo of blunted investor activity and freaked out homebuyers wanting more space.
-
“Toward the end of the HomeBuilder scheme in 2021, the portion of residential purchases that were houses have trended lower, and are currently back toward pre-COVID levels. In 2022, there was also a peak in the premium on national house values relative to units. The median house in Australia reached a record 32.9% above the median unit value. This has also since trended lower, with the median house value sitting 28.3% higher in February 2023.”
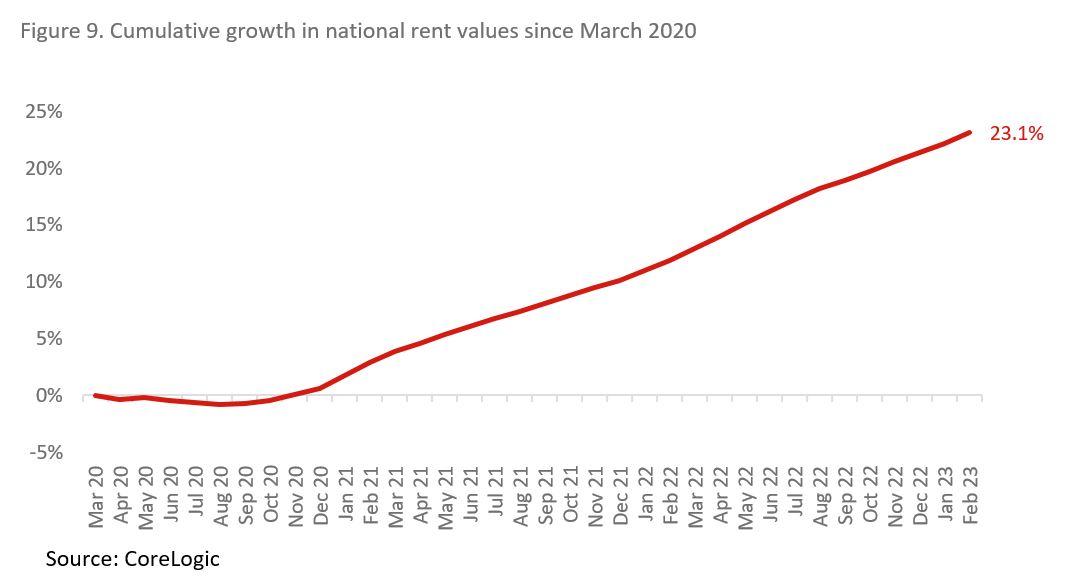
5. The rental market has been rocked by the pandemic.
-
Eliza reckons the rental market has been changed, man.
-
(Rentals) have ‘arguably sustained the most significant and lasting change from the pandemic.’
-
Cumulative growth in rent values since the onset of the pandemic nationally is 23.1%.
-
This is likely to have come as a shock to long-term renters, where annual growth in rent values averaged just 2.1% nationally throughout the 2010s.
-
Now, with net inflows of OS migration likely to return to pre-pandemic levels
-
And with a rental vacancy rate of just 1.0% in February, there is no indication of rents going backwards nationally
-
That’s bad, BTW. It really sucks finding a place.
In summation, please Eliza:
Unprecedented expansionary fiscal and monetary policy (and subsequent tightening), heavy border closures (and reopening) and the normalisation of remote work amid lockdowns were pandemic bi-products that influenced housing markets. Housing market performance in the past three years shows extraordinary, record-breaking figures. While some metrics are pointing in the direction of prepandemic norms, other parts of the housing market have seen lasting changes.
The post From COVID and back again: An Aussie housing tale appeared first on Stockhead.
monetary
markets
policy
interest rates
expansionary
monetary policy


Argentina Is One of the Most Regulated Countries in the World
In the coming days and weeks, we can expect further, far‐reaching reform proposals that will go through the Argentine congress.

Crypto, Crude, & Crap Stocks Rally As Yield Curve Steepens, Rate-Cut Hopes Soar
Crypto, Crude, & Crap Stocks Rally As Yield Curve Steepens, Rate-Cut Hopes Soar
A weird week of macro data – strong jobless claims but…

Fed Pivot: A Blend of Confidence and Folly
Fed Pivot: Charting a New Course in Economic Strategy Dec 22, 2023 Introduction In the dynamic world of economics, the Federal Reserve, the central bank…
