Economics
“First thing we do, let’s gag all the economists”: China Edition
Apologies (as always) to Shakespeare. From Sun Yu in the FT: “As the entire market is aware, there is no such thing as deflation in China,” a prominent…

Apologies (as always) to Shakespeare. From Sun Yu in the FT:
“As the entire market is aware, there is no such thing as deflation in China,” a prominent economist told a closed-door conference in Beijing in response to a question about deflationary risks. “We could, however, talk about low inflation [risks],” they added, asking the audience to be prudent in choosing which part of his remarks to report.
“It will be bad if you don’t see me tomorrow,” the economist said.
Now, one might say that in all governments, economists are not free to say in public what they think, particularly if their views do not align with the administration’s view. (In my experience in USG, it was only policy level appointees that could speak on the administration’s behalf regarding policies. Regarding the data, civil servants could discuss the data freely; obviously things change in different administrations, see 2017). But in the current situation, the Chinese government is putting pressure on private sector actors (economists in brokerages, universities).
There doesn’t seem to be much public discussion of the reliability of price data in China (and I’m not privy to any private discussion), but the numbers look bad enough (from this July 10 post).
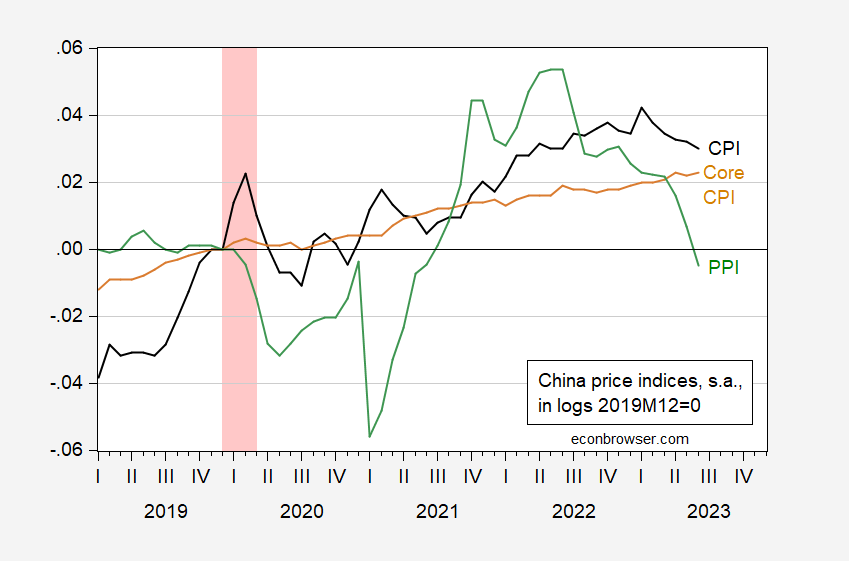
Figure 1: China CPI (black), core CPI (tan), and PPI (green), all in logs, 2019M12=0. ECRI defined peak-to-trough recession dates shaded pink. Source: Kose/Ohnsorge – World Bank and IMF, IFS, both updated using TradingEconomics; and author’s calculations.
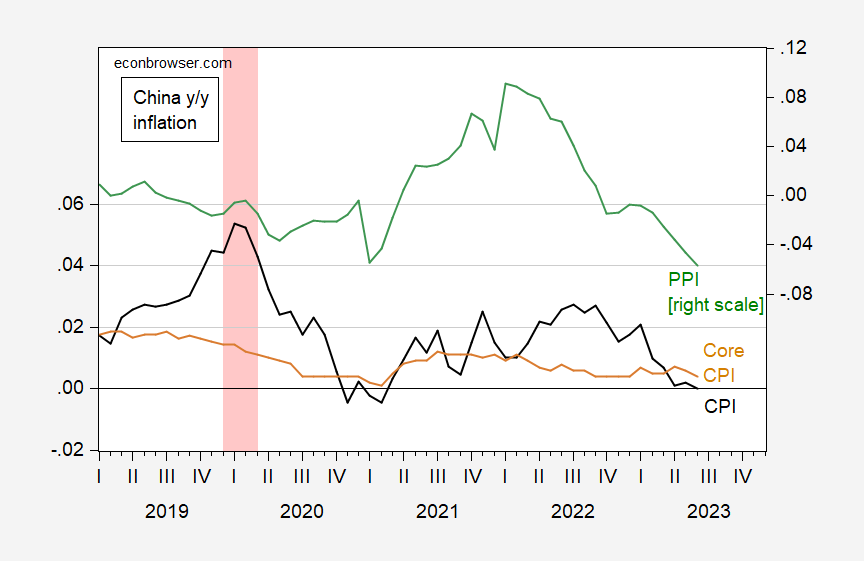
Figure 2: China year-on-year inflation rate for CPI (black), for core CPI (tan), and for PPI (green). ECRI defined peak-to-trough recession dates shaded pink. Source: Kose/Ohnsorge – World Bank and IMF, IFS, both updated using TradingEconomics; and author’s calculations.
I think there’s also some reason to wonder a bit about the GDP numbers, given previous difficulties I (Chinn 2021), and others (Fernald, Mueller, and Spiegel, 2021 ), have had reconciling the various GDP series reported by NBS. From the July 16th post on the GDP and IP release.
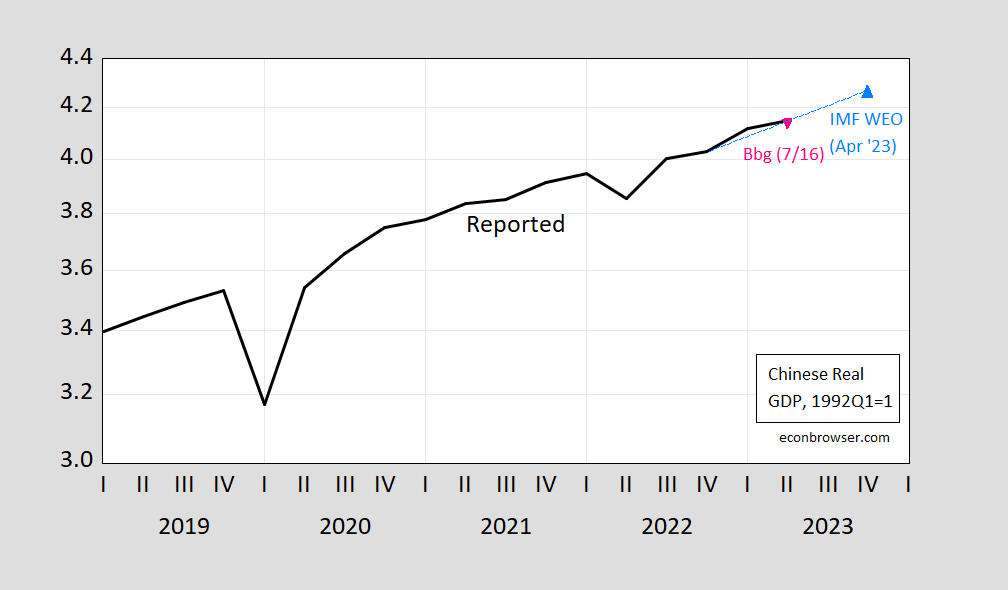
Figure 3: Real GDP, 1992Q1=1 (black), Bloomberg consensus of 7/16 (red triangle), IMF WEO April 2023 (light blue triangle). Source: OECD, IMF WEO, Bloomberg.
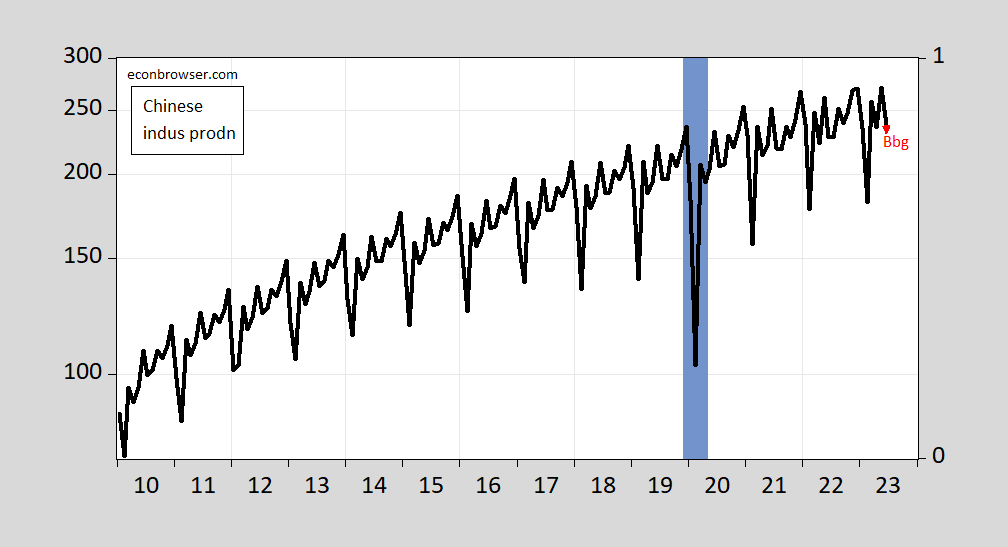
Figure 2: Chinese industrial production ex-construction (black), Bloomberg consensus of 7/16 (red triangle). ECRI defined peak-to-trough recession dates shaded blue. Source: OECD, Bloomberg, ECRI.
Just think of all this as part of an ongoing escalating suppression of economic information, (see Thomas Hale’s recent FT article on the black box of revisions and seasonal adjustments) accelerated by the disappointing numbers on economic activity.
Stay tuned for more on the plausibility of the 2023Q2 GDP numbers.


Argentina Is One of the Most Regulated Countries in the World
In the coming days and weeks, we can expect further, far‐reaching reform proposals that will go through the Argentine congress.

Crypto, Crude, & Crap Stocks Rally As Yield Curve Steepens, Rate-Cut Hopes Soar
Crypto, Crude, & Crap Stocks Rally As Yield Curve Steepens, Rate-Cut Hopes Soar
A weird week of macro data – strong jobless claims but…

Fed Pivot: A Blend of Confidence and Folly
Fed Pivot: Charting a New Course in Economic Strategy Dec 22, 2023 Introduction In the dynamic world of economics, the Federal Reserve, the central bank…
