Economics
Fed’s Dots Imply Highest Treasury Yields Since 2000
Fed’s Dots Imply Highest Treasury Yields Since 2000
By Ven Ram, Bloomberg Markets Live reporter and cross-asset strategist
The resounding…
Fed’s Dots Imply Highest Treasury Yields Since 2000
By Ven Ram, Bloomberg Markets Live reporter and cross-asset strategist
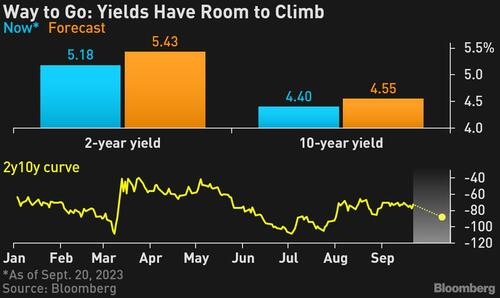
The resounding selloff in front-end Treasuries we have seen in this cycle isn’t done yet, with yields likely to reach the highest in more than two decades should the Federal Reserve follow the path of its latest dot plot.
Treasury two-year yields will reach 5.43%, a level not seen since December 2000, if the Fed were to raise rates once more in this cycle and the US labor market continues to stay resilient through the spring of 2024.
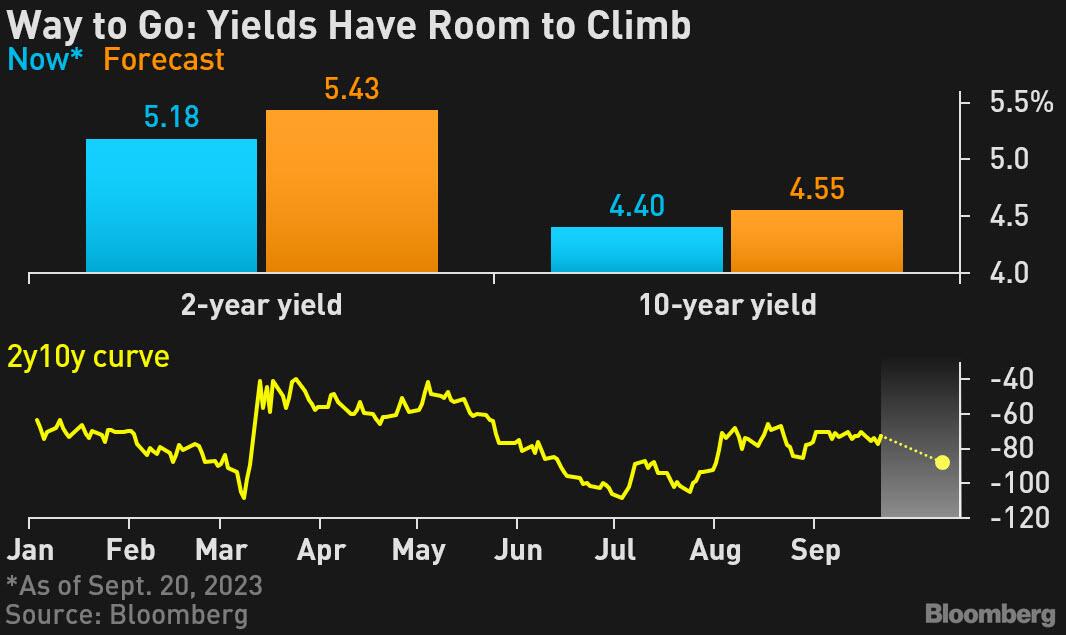
The Fed’s stance — together with rising real rates — also spells bearishness for 10-year bonds, with that yield likely to hit 4.55%. That implies a deeper curve inversion, with the differential between the two maturities set to reach -88 basis points from -75 basis points now.
The outlook marks an update to my previous view, where I had suggested the two-year yield might reach 5.22%.
The bearish revision stems from the Fed’s dot plot for September, which was pretty hawkish. The central bank — which had penciled in rate cuts of 100 basis points through 2024 when it met in June — took 50 basis points off the table, concurrent with a lower unemployment rate and faster inflation.
“Don’t fight the Fed” may be one of the oldest commandments in the financial markets, but traders have continually ignored what the central bank has been saying through much of this cycle, on conviction that a recession will force policy makers to pivot.
Almost a year ago, traders were similarly skeptical of the dot plot and reckoned that the Fed, whose benchmark rate then was 3.25%, would stop at 4.50%. And yet we are at 5.50% and counting.
Investors have been positioned for a recession since the middle of 2022 as the yield curve inverted. But so far, positioning for rate cuts has failed to pay off. As happened before the dotcom bubble and the financial crisis, the yield-curve inversion may continue for long before we actually see an economic contraction.
Meanwhile, real rates have also been surging, with the 10-year yield having shot up above 2% — a far cry from levels of zero that prevailed at the start of the pandemic. That may be due to a structural shift in the markets, and so long as that trend continues, 10-year nominal yields will stay aloft.
What could go wrong with the outlook for Treasuries? The resilience in the labor market may snap abruptly, which would cause the markets to pivot and the Fed to abandon its dot plot.
Two-year Treasuries have had an eminently forgettable 2023 so far, and indications suggest that there is no turnaround in sight
Tyler Durden
Thu, 09/21/2023 – 11:45
inflation
markets
reserve
policy
fed
central bank
bubble


Argentina Is One of the Most Regulated Countries in the World
In the coming days and weeks, we can expect further, far‐reaching reform proposals that will go through the Argentine congress.

Crypto, Crude, & Crap Stocks Rally As Yield Curve Steepens, Rate-Cut Hopes Soar
Crypto, Crude, & Crap Stocks Rally As Yield Curve Steepens, Rate-Cut Hopes Soar
A weird week of macro data – strong jobless claims but…

Fed Pivot: A Blend of Confidence and Folly
Fed Pivot: Charting a New Course in Economic Strategy Dec 22, 2023 Introduction In the dynamic world of economics, the Federal Reserve, the central bank…
