Economics
Estimating Downside Market Risk
Estimating Downside Market Risk
Excerpted from John Hussman’s Market Comment,
"I realize that the entire tenor of market commentary here…

Estimating Downside Market Risk
Excerpted from John Hussman’s Market Comment,
“I realize that the entire tenor of market commentary here is ‘A good investor rides out the storms. Hold for the long term and you’ll be fine.’ The problem is that market participants stopped being investors when they accepted the notion that stocks are always attractive regardless of the price paid for them. Though prices have moved down rapidly, I have not seen much evidence that investors have actually reduced their exposure. Yes, they feel pain, but they’re hoping that the pain will end without the necessity of doing anything. Again, the real problem is that they have no concept of value. They’re looking at how far prices have declined, and have decided that this must be enough. But unless they understand value, they do not realize how much lower prices would have to decline just to attain median historical valuations. Value is not measured by how far prices have declined, but by the relationship between prices and properly discounted cash flows. On that basis, the market could have a deep follow-through ahead. We’ll take our signals as they come.”
– John P. Hussman, Ph.D., March 15, 2001
At the beginning of 2022, our most reliable stock market valuation measures stood at record levels, beyond even their 1929 and 2000 extremes. The 10-year Treasury yield was at 1.5%, the 30-year Treasury bond yield was at 1.9%, and Treasury bill yields were just 0.06%. By our estimates, that combination produced the most negative expected return for a conventional passive investment portfolio in U.S. history. Year-to-date through October 14, 2022, the S&P 500 has lost -23.9% including dividends, 10-year Treasury bonds have lost -18.1%, and 30-year Treasury bonds have lost -33.8%.
…
The prospects for S&P 500 total returns have certainly improved since the beginning of the year, but they are still far from adequate.
There are only two ways to make them adequate:
-
either prices must decline further, or
-
prices must stagnate for more than a decade while fundamentals catch up.
My impression is that we’re likely to see a combination of both, resulting in what I’ve often called a “long, interesting trip to nowhere.” This outcome would mirror what investors experienced during 1929-1947, 1966-1985, and 2000-2013. In each case, the S&P 500 lagged Treasury bills for more than a decade. That’s 50 years out of 84. Starting valuations matter.
…
Estimating downside market risk
There are three principal phases of a bull market: the first is represented by reviving confidence in the future of business; the second is the response of stock prices to the known improvement in corporate earnings, and the third is the period when speculation is rampant – a period when stocks are advanced on hopes and expectations. There are three principal phases of a bear market: the first represents the abandonment of the hopes upon which stocks were purchased at inflated prices; the second reflects selling due to decreased business and earnings, and the third is caused by distress selling of sound securities, regardless of their value, by those who must find a cash market for at least a portion of their assets.
– Robert Rhea, The Dow Theory, 1932
The “completion” of a market cycle involves the repricing of valuations from rich or extreme levels that imply poor or dismal long-term expected returns – to run-of-the-mill or depressed lows that imply reasonable or outstanding long-term returns. In my view, the market losses that we have observed during 2022 to-date represent what Robert Rhea described in 1932 as the “first principal phase” of such a retreat – “the abandonment of hopes upon which stocks were priced at inflated prices” – in this case, the abandonment of the notion that the Federal Reserve could forever hold interest rates at zero without consequence. We have not yet observed “selling due to decreased business and earnings,” much less “distress selling of sound securities, regardless of their value.”
As I noted in March 2001 – after a -23% loss in the S&P 500, which would be followed by a further market collapse over the next 18 months, and more than a decade of S&P 500 total returns below T-bill yields – “They’re looking at how far prices have declined, and have decided that this must be enough. But unless they understand value, they do not realize how much lower prices would have to decline just to attain median historical valuations. Value is not measured by how far prices have declined, but by the relationship between prices and properly discounted cash flows.”
When the cash flows are very long-term in nature, as they are with 50-year U.K. gilts, or 30-year Treasury bonds, or common stocks, seemingly moderate increases in long-term return can imply profound market losses. When the deviation from median historical valuations is extreme, simply attaining those run-of-the-mill valuation norms can imply seemingly preposterous losses – then the market suffers seemingly preposterous losses anyway.
Over the past 5 years, the revenues of S&P 500 technology companies have grown at a compound annual rate of 12%, while the corresponding stock prices have soared by 56% annually. Over time, price/revenue ratios come back in line. Currently, that would require an 83% plunge in tech stocks (recall the 1969-70 tech massacre). The plunge may be muted to about 65% given several years of revenue growth. If you understand values and market history, you know we’re not joking.
– John P. Hussman, Ph.D., March 7, 2000
Just before, well, an 83% plunge in the tech-heavy Nasdaq 100 Index
The chart below provides some insight into the market loss we estimate would be required to restore even run-of-the-mill historical valuation norms. The blue line in the chart below is based on MarketCap/GVA, showing the market loss necessary to bring expected S&P 500 returns to the higher of a) the 10% long-term historical norm, or; b) a 2% risk-premium over-and-above Treasury bond yields. The red shaded area shows the deepest actual loss of the S&P 500 over the subsequent 30-month period – that shading stops 30 months ago since we don’t yet know the deepest loss for more recent periods.
Notice that the 2000-2002 market loss did not quite restore historical valuation norms. Of course, the S&P 500 also posted a negative total return between its October 2002 low and its March 2009 low. Investors can run from overvaluation – defying it with speculation for extended periods of time – but ultimately, they can’t hide.
You’ll also notice that there’s often quite a bit of white space before the blue troughs become full of red ink. Those white spaces represent potential risk that has not yet been realized. Speculators have certainly enjoyed a great deal of white space in recent years. But it’s exactly that long period of speculation without consequences that makes potential market losses so deep. Seemingly preposterous, even.
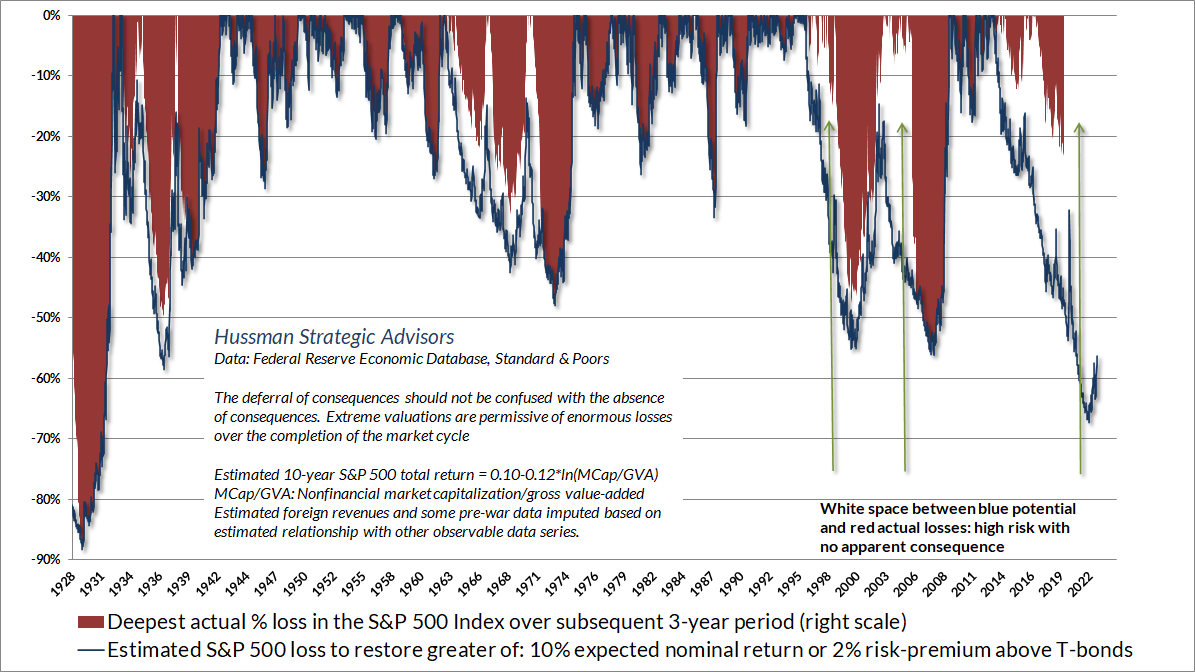
Restoring even historically run-of-the-mill valuations would require a loss of about -67% in the S&P 500 from its recent speculative peak. As I wrote just before the 2000 bubble collapsed, if you understand values and market history, you know we’re not joking.
When the cash flows are very long-term in nature, and the deviation from median historical valuations is extreme, simply attaining those run-of-the-mill valuation norms can imply seemingly preposterous losses. Then the market suffers seemingly preposterous losses anyway.
Returning to Robert Rhea’s 1932 observations, my impression is that year-to-date market losses represent the first phase of unwinding from the steepest speculative extreme in history. I’ve got no particular views about whether this phase is complete. Our own discipline is to respond to observable market conditions – primarily valuations and market internals – and to shift our investment stance as those conditions shift. No forecasts are required.
That said, I do believe that the second phase of this unwinding is likely to accompany an avalanche of earnings disappointments in the quarters ahead. We should certainly expect periods of market loss to be punctuated by clearing rallies, even extended ones, that are “fast, furious, and prone-to-failure.” Broad improvement in the uniformity of market internals could even support more extended periods of speculation.
Still, valuations are nowhere near levels that we associate with satisfactory long-term market returns, so I suspect that more shoes will drop. In any event, we’ll respond to observable conditions as those conditions change.
…
The bottom line depends on your investment horizon. From a short-term perspective, we should certainly expect periods of market loss to be punctuated by clearing rallies that are “fast, furious, and prone-to-failure.” We periodically reduce the extent of our defensiveness when the market becomes particularly oversold, but we’re not inclined to take outright bullish positions in an overvalued market with still-unfavorable internals. Broad improvement in the uniformity of market internals could signal fresh speculation, but we’ll respond to that sort of shift when we observe it. No scenarios or forecasts are required. From the standpoint of long-term returns and potential full-cycle losses, valuations are nowhere near levels that we associate with satisfactory outcomes.
Our most reliable equity market valuation measures project 10-12 year S&P 500 total returns near zero, implying that the “equity risk premium” relative to bonds is still negative. Likewise, bond yields remain inadequate relative to prevailing inflation, employment, and economic conditions. Meanwhile, market internals continue to suggest persistent risk-aversion among investors, and yield pressures – at least for now – remain upward. Taking these conditions together, it’s worth repeating that a market collapse is nothing but risk-aversion meeting an inadequate risk-premium; rising yield pressure meeting an inadequate yield. Short-term volatility and clearing rallies aside, our outlook remains defensive here.
Tyler Durden
Thu, 10/20/2022 – 14:19
inflation
reserve
interest rates
bubble


Argentina Is One of the Most Regulated Countries in the World
In the coming days and weeks, we can expect further, far‐reaching reform proposals that will go through the Argentine congress.

Crypto, Crude, & Crap Stocks Rally As Yield Curve Steepens, Rate-Cut Hopes Soar
Crypto, Crude, & Crap Stocks Rally As Yield Curve Steepens, Rate-Cut Hopes Soar
A weird week of macro data – strong jobless claims but…

Fed Pivot: A Blend of Confidence and Folly
Fed Pivot: Charting a New Course in Economic Strategy Dec 22, 2023 Introduction In the dynamic world of economics, the Federal Reserve, the central bank…
