Economics
Dollars Are For Spending & Investing, Not Saving
“I need the US Dollar to be a store of value between the time I make it until I spend it, invest it, pay my taxes with it, or give it away….

“I need the US Dollar to be a store of value between the time I make it until I spend it, invest it, pay my taxes with it, or give it away. It does that splendidly.” 1
Today, we’re going to look at a perennial (un)favorite #chartfail. To be more precise, I want to discuss the type of chart that reflects a fundamental misunderstanding of the nature of money, currency, spending, investing, and taxes. I’ve mentioned this in the past, but I happened across the chart above, and it serves as a reminder to revisit this topic in greater detail.
You get paid in dollars. That compensation is in a currency that is a widely accepted medium of exchange. I work 40-60 hours a week and get paid for my time and efforts. That comp gets deposited directly into my bank account, and that money is available for purchasing necessities (food, housing, clothing, medicine, transportation, etc.) and paying taxes.
But that’s not all: I also have the opportunity to invest those dollars: I can buy a broad market index, expecting it’ll appreciate; I can buy bonds and enjoy the income they yield; I could purchase real estate, which either gives me a place to live or rent out for income; I could also use that money to start or build a business.
In each of those four categories, the dollars I invest will generate a return over time. And over the past few centuries, those returns have greatly exceeded inflation. And that’s the key misunderstanding of charts like the one above: It ignore the time value of money.
Whether it’s a few decades or a century, the math works the same.
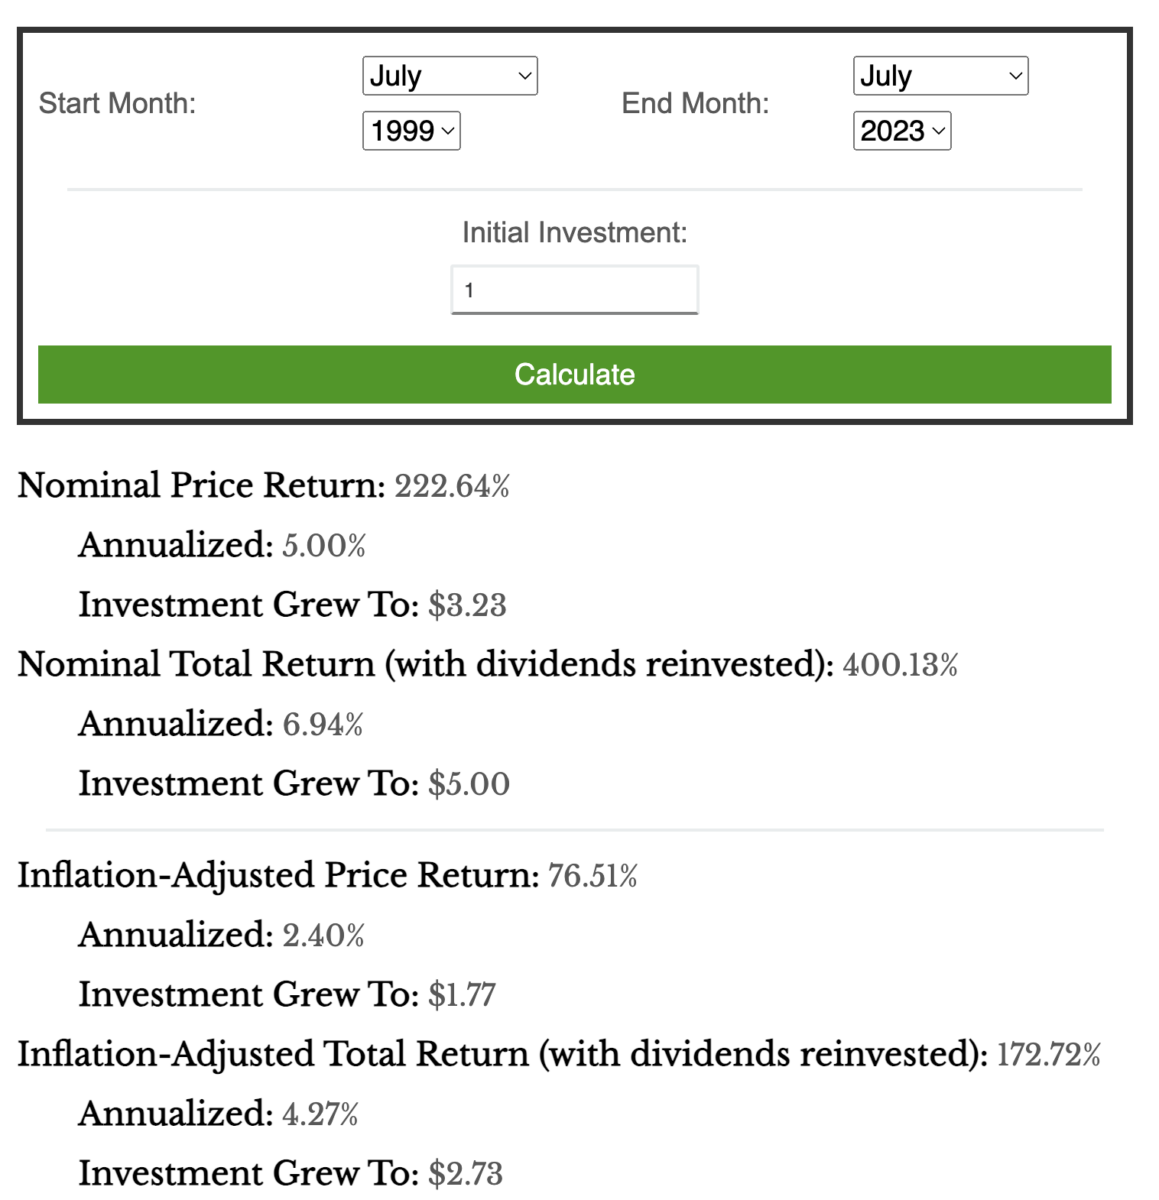
 Back to our colorful chart at top. Sure, it now takes $1.84 to buy that dollar of 1999 food. But had you put that into a simple investment like the S&P500 instead of holding the dollars, it would have grown at an annual rate of 6.94% per year and be worth about $5 dollars.2 You could buy those groceries and still have $3.16 left over.
Hey, what a very different outcome than suggesting a loss of purchasing power — if you understand money and math, you have actually gained purchasing power.
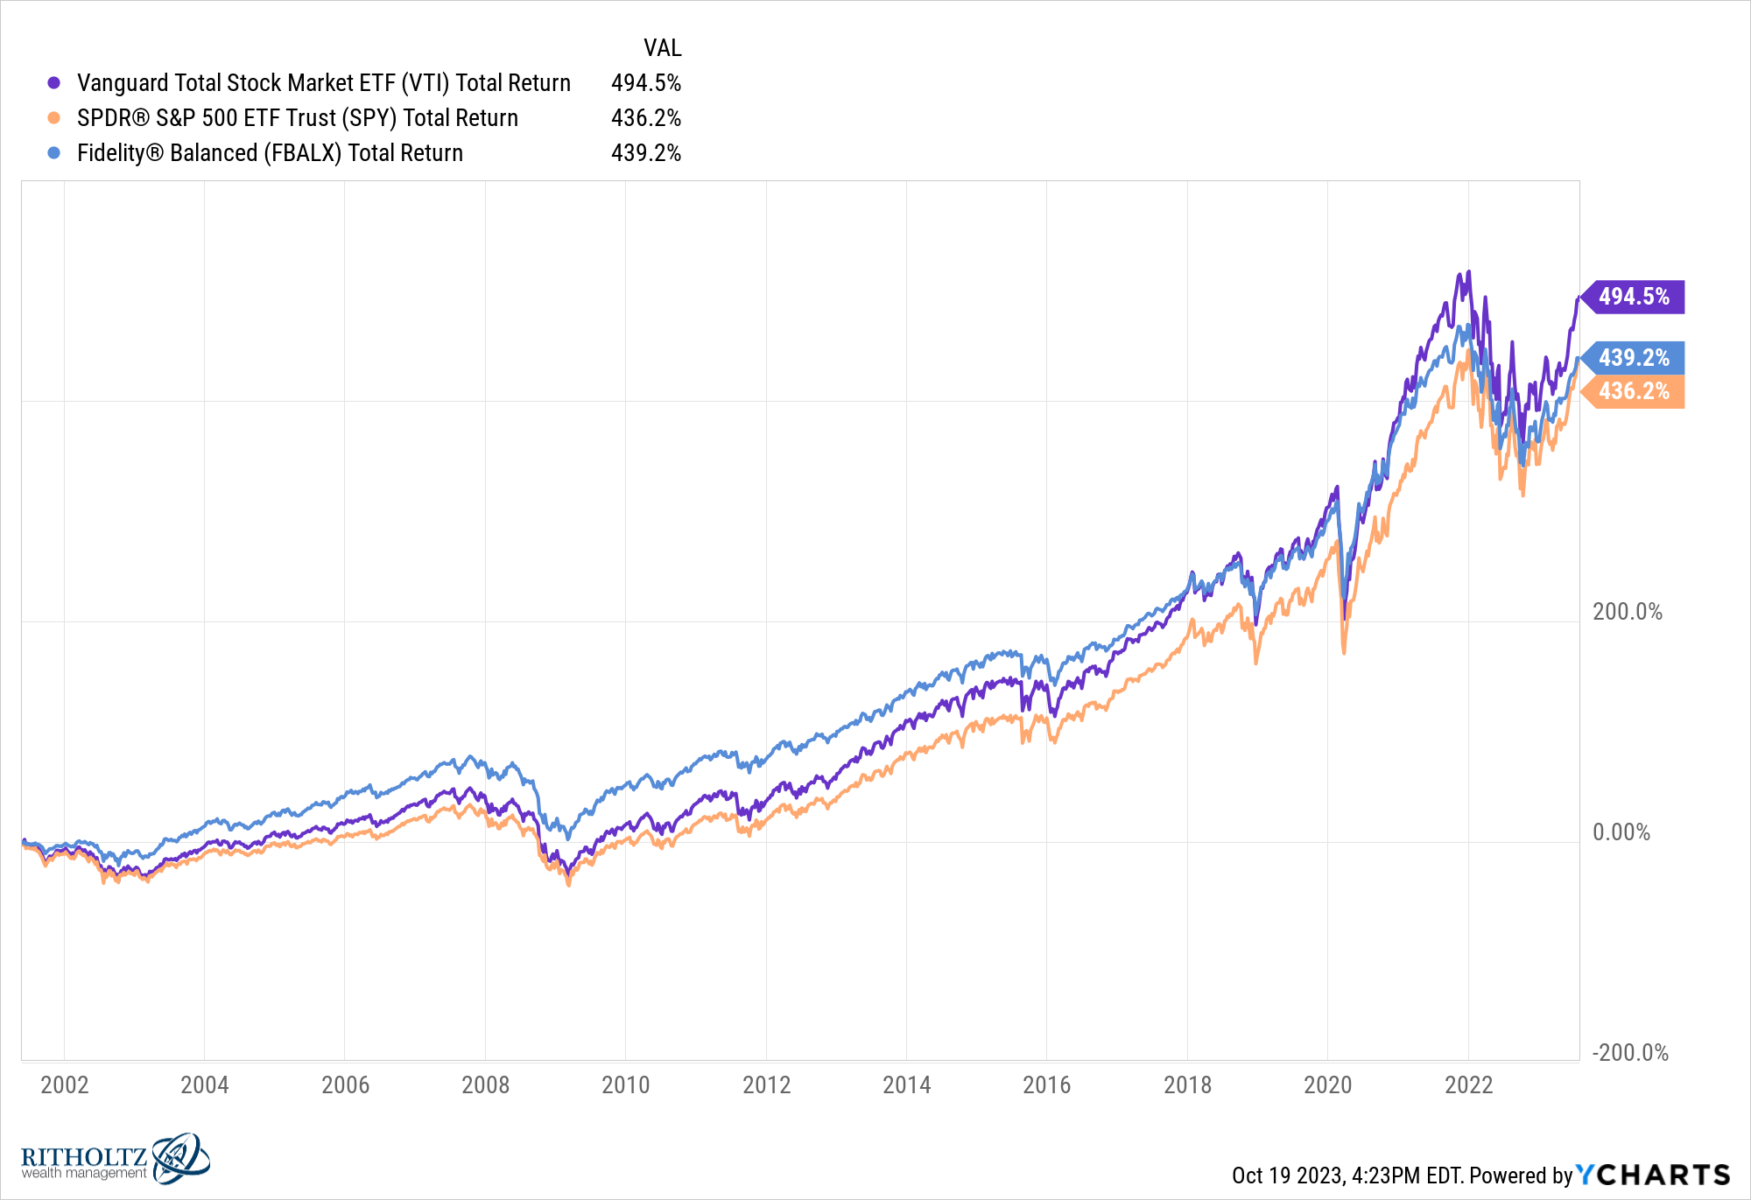
Instead of cherry-picking the S&P 500, what about a simple 60/40 portfolio (e.g., Fidelity Balanced Fund, FBALX)? You would have done slightly worse, gaining about 6.7% per year.3 And the Vanguard Total Market (VTI) would have done slightly better, garnering about 7.8% annually over the same period.4
I always dislike these one-sided arguments – Come see how much the dollar has depreciated over a century! I never can tell if it’s purposefully misleading, ignorant, or full-blown Russian propaganda. All I do know is these are crap charts that reveal little other than their creator’s fundamental misunderstanding of science finance.
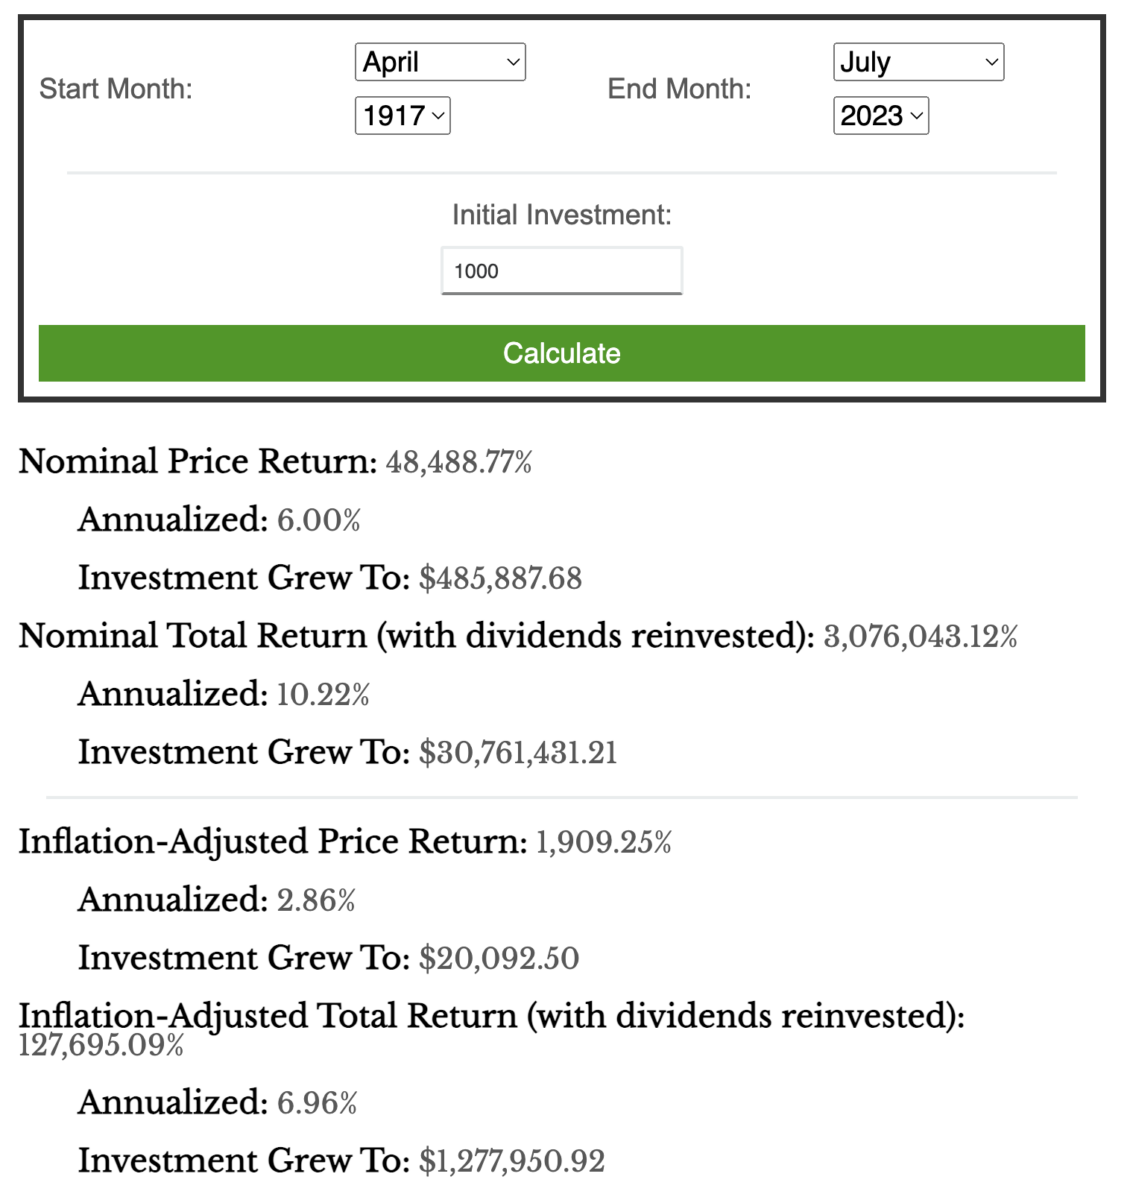
Let’s imagine two people, each with $1,000 dollars, getting ready to go off to World War I in April 1917. One decides to bury them in mason jars in the backyard, while the other sets up an account held in trust. Their descendants each take possession of these in July 2023. If it was your great-grandpappy who buried the cash, sorry, it’s now worth 96% less than April 1917. But if it was your ancestor who put that $1,000 into equities over that same period, well congratulations. the market has returned about 10.22% a year, and that small fortune grew to an enormous, now worth over $30 million.5
Currency like the U.S. Dollar is a medium of exchange, not a store of value. As such, they are never supposed to be left hanging around for years or decades; burying them for centuries is just laughable.
Dollars are for spending and investing; they are a medium of exchange, not a store of value, and they are not just counting…
Source:
How Far Does $1 From 1999 Go Today?
by Shri Khalpada
PerThirtySix, August 14, 2023
__________
1. My Tweet from 10:33 AM · Oct 12, 2021
2. $1 in the S&P500 with dividends reinvested grew 6.94% annualized; over that 24-year period it would have grown to $5.00; data returns from Nick Maggiulli’s S&P 500 Historical Return Calculator [With Dividends]
3. $1 in the 60/40 portfolio with dividends reinvested grew at 6.30% annualized; over that 24-year period it would have grown to $4.36 ; data returns from Nick Maggiulli’s U.S. Stock/Bond Historical Return Calculator.
4. $1 in the Vanguard Total Stock Market ETF (VTI) with dividends reinvested grew 7.87% annualized; over that 24-year period, it would have grown to about $5.67.
5. $1,000 in the S&P500 with dividends reinvested would return 10.22% annualized, and from April 1917 to today would be worth $30,761,431.21; data returns from Nick Maggiulli’s S&P 500 Historical Return Calculator [With Dividends]
Matching the above 1999 inflation chart:
S&P500 Returns, July 1999 to July 2023
60/40 Returns, July 1999 to July 2023
The post Dollars Are For Spending & Investing, Not Saving appeared first on The Big Picture.


Argentina Is One of the Most Regulated Countries in the World
In the coming days and weeks, we can expect further, far‐reaching reform proposals that will go through the Argentine congress.

Crypto, Crude, & Crap Stocks Rally As Yield Curve Steepens, Rate-Cut Hopes Soar
Crypto, Crude, & Crap Stocks Rally As Yield Curve Steepens, Rate-Cut Hopes Soar
A weird week of macro data – strong jobless claims but…

Fed Pivot: A Blend of Confidence and Folly
Fed Pivot: Charting a New Course in Economic Strategy Dec 22, 2023 Introduction In the dynamic world of economics, the Federal Reserve, the central bank…


