Economics
“Does Not Appear Sustainable”: The US Budget Deficit Is Unexpectedly Soaring Again And It’s About To Get Much Worse
"Does Not Appear Sustainable": The US Budget Deficit Is Unexpectedly Soaring Again And It’s About To Get Much Worse
It was supposed to be…

“Does Not Appear Sustainable”: The US Budget Deficit Is Unexpectedly Soaring Again And It’s About To Get Much Worse
It was supposed to be a year when the normalization of the record US budget deficit blowout from the covid collapse continued; it has ended up being anything but.
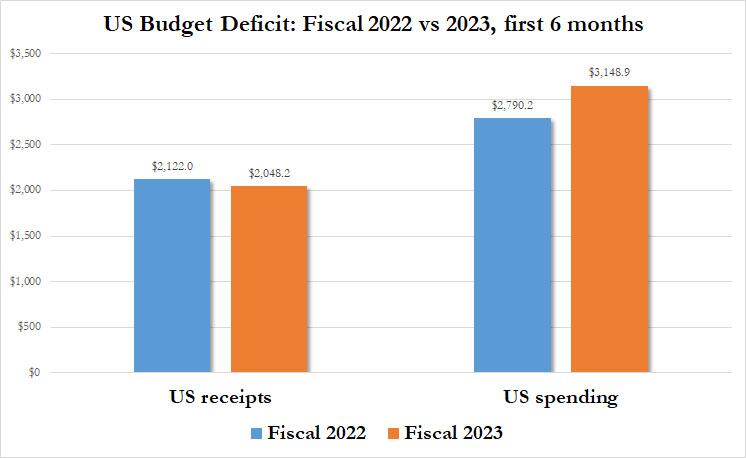
As the US Treasury revealed in its latest Monthly Treasury Statement, in the first six months of the fiscal year ended March 31, the US fiscal picture is once again deteriorating rapidly, on both revenue and spending. As shown in the chart below, gross revenues declined by 4% to $2.048 trillion from $2.121 trillion in the same period a year earlier, while spending over the same period soared by $358 billion to $3.149 trillion from $2.790 trillion.
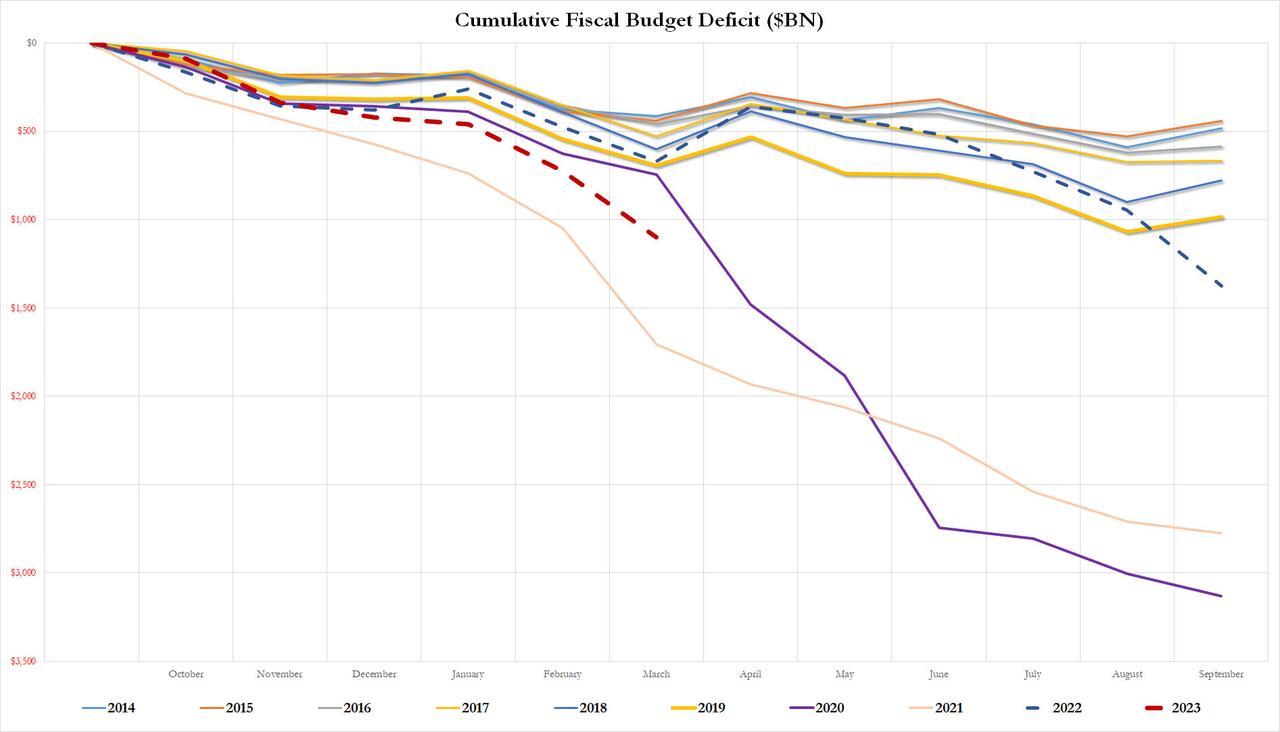
Added across, in March the US deficit soared by $378 billion – the biggest monthly deficit since September 22, the last month of the previous fiscal year, and for the first six months of 2023 the total US deficit jumped to $1.10 trillion, up a massive 65% compared to the year prior. More shocking is that this year’s deficit is not that much lower compared to the record trailing 6 month total hit in fiscal 2021 when the deficit was $1.7 trillion for the first six months of fiscal 2021, a time when helicopter money was flowing into the economy at a record pace and setting the stage for the explosive surge in inflation that lingers to this day.
This unexpected surge in the deficit is creating everything from ripple effects in the political arena where the issue of raising the debt ceiling is about to become quite jarring especially now that the US has resumed its “drunken sailor” spending ways; to shockwaves when it comes to calculations for when the Treasury default X-date will hate, as we explained earlier.
So what’s behind this sudden deficit explosion, and why is it on such a higher path halfway through FY 2023? Here are the 4 main factors as explained by BofA’s Mark Cabana:
- First, the omnibus budget bill passed last December increased discretionary spending by roughly 9% compared to FY2022. There were increases for both defense and nondefense spending of roughly 10% and 8% respectively.
- Second, cost of living adjustment increases to social security (8.7% specifically) has contributed to the 5% y/y increase in social welfare payments this year compared to last.
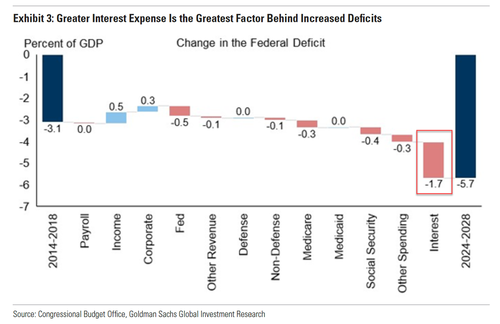
- Third, interest costs have ballooned owing to the Fed’s aggressive hiking cycle and the massive amount of debt accumulated from pandemic related fiscal stimulus.
- Fourth and final, since tax brackets are indexed to inflation, higher inflation last year led to a roughly 7% increase in tax brackets, which has led to less income tax revenue.


These factors explain why the budget deficit is 65% higher than it was a year ago at the halfway mark; it also explains why the deficit will increase substantially this year compared to last. Indeed, the Congressional Budget Office (CBO) projects a deficit of $1.410tn for FY 2023 compared to $1.375tn in FY 2022. This may look like a rather small increase based on where the deficit is tracking but recall that last year’s deficit was boosted roughly $400bn because of the way government accounting treated the student loan forgiveness program.
The bottom line is that the risks around the deficit are skewed to the upside, especially given growing sentiment that the US will not avoid a recession in 3Q (certainly not if the Fed keeps rate high enough, in which case it will be the first voluntarily Fed-induced recession which will spark a gusher of liquidity when the Fed breaks so many more things than just a few regional banks).
But wait, there’s much more (or rather, less) because while spending is tracking substantially higher, tax returns are now below last year’s levels.
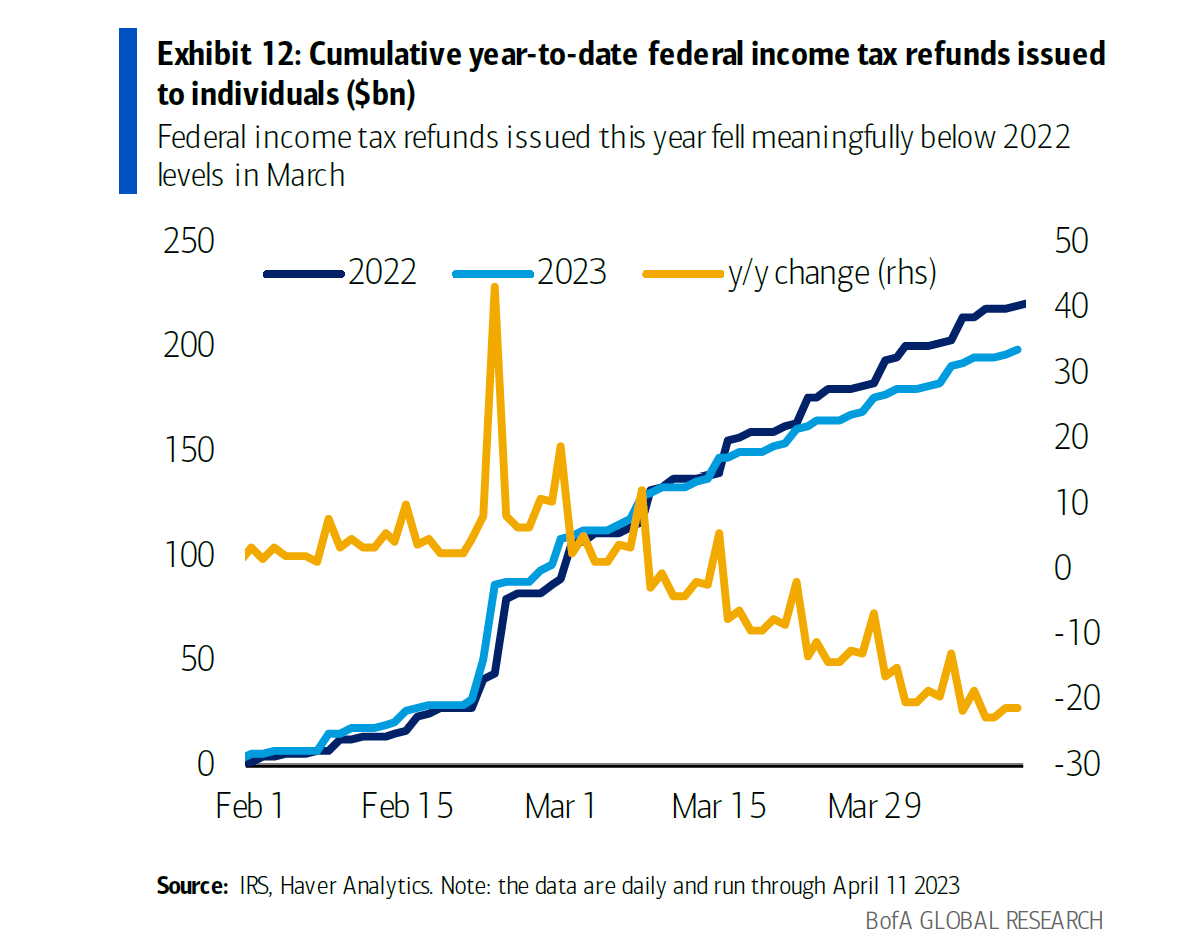
Cumulative refunds are down 9.5% y/y through April 11, 2023 largely due to a 9.8% decline in average returns, even as the number of returns processed is up 0.4% compared to a year ago. One of the key reasons for the smaller average tax return this year is due to the expiration of the expanded tax credit. Lower average tax returns should translate into higher aggregate personal income tax receipts in April, all else equal.
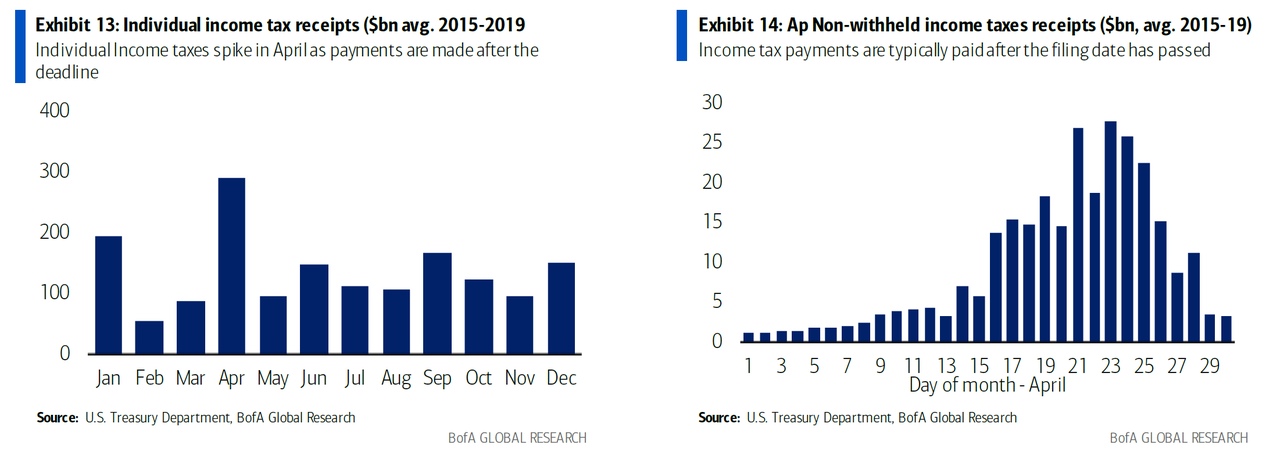
That said, the full effect of income tax season will not be known until after the date passes when payments start to roll in. Indeed, income tax payments more than offset refunds. This is why income tax receipts spike in April and more specifically after the filing data as payments are made to the Internal Revenue Service.
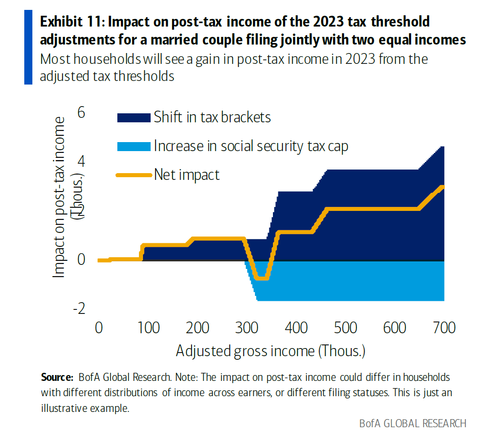
While so far there are no projections of where total personal income tax revenue will end up this month, we can form expectations based on the data in hand and the changes to the tax system with the help of some observations from BofA’s Cabana: First, individual tax receipts are down 14% through April 11 compared to the same period a year ago. Second, as shown in Exhibit 11, we know that the increase in tax brackets will reduce payments for most households. Moreover, the benefit is greater for higher income households that tend to owe taxes rather than receive refunds. Therefore, it’s highly likely we see personal income tax collections this April down from last year as lower payments should more than offset smaller than refunds.
This means it is very likely that income tax receipts will be down as much as 14% compared to a year ago, which would translate into $83bn less in revenue. BofA sees this as a likely upper bound on the decline in income taxes as wages and employment are up from a year ago (or at least that ‘s what the BLS is reporting). That said, a decline in income taxes from last April is likely and will extend the ongoing decline in income taxes compared to the previous year, which – as we discussed earlier – will also add to the risks of an earlier X (or Treasury default) date.
As for the long-term picture, we give the final word to Goldman’s political economist Alec Phillips: “After ten years, we project federal debt to reach nearly 120% of GDP, topping the peak 106% of GDP debt level immediately following WWII, while interest expense tops 4% of GDP. In the very near term, however, the debt/GDP ratio is likely to rise slowly, as nominal growth runs ahead of nominal interest expense, which will take several years to catch up to market interest rates.”
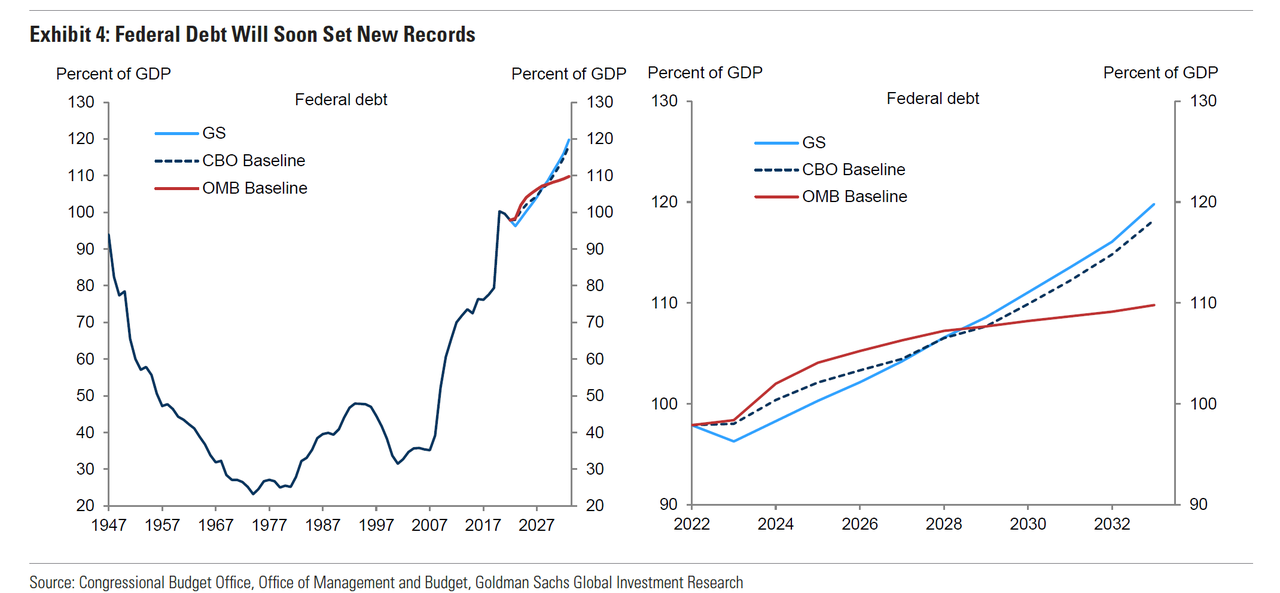
It gets worse: “There are two additional budget-unfriendly risks to these figures. First, we do not include a recession in our projection, but the cumulative deficit impact of the past 7 recessions averages 13% of GDP. Second, higher debt levels are likely to lift borrowing costs, adding further to the debt. Accounting for these risks suggests that public debt as a share of GDP could double over the next 30 years if policy remains unchanged.“
Goldman’s punchline: “The steady rise in the debt/GDP ratio that we and others project does not appear to fit in the definition of sustainability.” In other words, the US may avoid a default in a few months, but the endgame is clear, as even the CBO revealed.
US to add $19TN in debt over next decade according to the CBO’s conservative estimate and debt as % of GDP will double by 2053 to 195%.
Congrats MMT, you won. pic.twitter.com/MvoJwxz6Cf
— zerohedge (@zerohedge) February 15, 2023
But fear not: the good news is that the US “democracy” is in perfectly fine working order, and America’s qualified, highly competent and compromising politicians will be sure to find a solution to this “unsustainable” problem long before it’s too late.
Supporting data and much more can be found in the source reports from Bank of America and Goldman available to professional subs in the usual place.
Tyler Durden
Mon, 04/17/2023 – 15:00
inflation
policy
interest rates
fed
mmt


Argentina Is One of the Most Regulated Countries in the World
In the coming days and weeks, we can expect further, far‐reaching reform proposals that will go through the Argentine congress.

Crypto, Crude, & Crap Stocks Rally As Yield Curve Steepens, Rate-Cut Hopes Soar
Crypto, Crude, & Crap Stocks Rally As Yield Curve Steepens, Rate-Cut Hopes Soar
A weird week of macro data – strong jobless claims but…

Fed Pivot: A Blend of Confidence and Folly
Fed Pivot: Charting a New Course in Economic Strategy Dec 22, 2023 Introduction In the dynamic world of economics, the Federal Reserve, the central bank…


