Economics
CPI Less Rent Was Zero for 3 Months; CPI Rent Is Wrong
Alan Reynolds
Each release of the Consumer Price Index (CPI) is greeted with great anxiety by world bond and stocks markets. That is because the Federal…

Each release of the Consumer Price Index (CPI) is greeted with great anxiety by world bond and stocks markets. That is because the Federal Reserve has repeatedly reacted to monthly CPI news by raising current and “projected” interest rates the Fed pays banks as a reward for holding reserves (IOR).
Raising the overnight rate on reserves, currently 3.15%, normally raises other interest rates though not always 10-year bond yields, which are more affected by foreign substitutes. And raising Fed policy rates usually raises the dollar.
“Inflation Report Seals Case for 0.75-Point Fed Rate Rise in November,” declared a Wall Street Journal headline about the CPI, as though it was evidently sensible for the Federal Open Market Committee (FOMC) to readjust interest rates on the basis of a one-month CPI report. On the contrary, the FOMC Statement on Longer-Run Goals and Monetary Policy Strategy points out, “Monetary policy actions tend to influence economic activity, employment, and prices with a lag.” For the Fed to increase interest rates on November 2 because a 75 bps increase September 25 failed to reduce the September CPI implies excessive impatience with lags. Some of the longest lags are built into the price indexes, particularly home rents (which as only indirectly sensitive to interest rates).
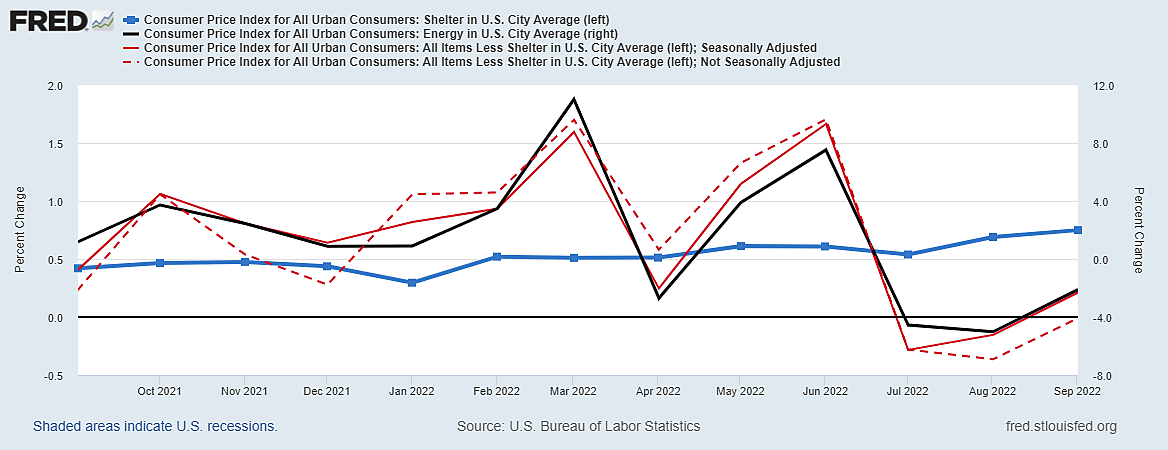
The most important single fact about the way we measure inflation is that shelter accounts for a third of the CPI. My graph focuses on the other two-thirds – all items less shelter – which exhibited zero inflation for the past three months.
The second most important fact about the way we measure inflation is that the two thirds of the CPI that excludes shelter is generally dominated by energy prices, the black line in the graph.
The solid red line is seasonally adjusted; the dashed one not. Before seasonal adjustment, CPI less shelter fell 0.28% in July, 0.36% in August and 0.01% in September. Seasonal adjustment transformed a tiny drop in September into a 0.2% rise yet left the average of all items in the CPI except shelter at zero or less for the past three months.
The blue line – called shelter in the CPI core services index – is home rents plus the estimated value of houses and condominiums if owners rented them. This blog exposes many faults of shelter costs in the CPI (and to a lesser extent the PCE), particularly how slow they are to reflect reality.
What makes three months of zero inflation in “all items less shelter” more remarkable is that it includes energy and food. It also includes other CPI service items based on last year’s facts, such as health insurance – based on industry profits ten months ago, and soon to fall.
“The Federal Reserve Bank of Atlanta tracks nine alternative indexes,” writes Greg Ip, “They show inflation ranging from 4.7% to 7.3%, far above the Fed’s target.” The lowest are two PCE indexes explicitly followed by the Fed; the highest are two Cleveland Fed indexes (median and trimmed) which exaggerate the already excessive weight of shelter in the CPI. All are year-to-year changes or 12-month averages, not recent.
The Atlanta Fed’s alternative price indexes measure past changes in prices over the past twelve months, not recent or future changes. The FOMC’s famed 2% target, by contrast, refers to a vague “long-run average” after 2025. The FOMC PCE inflation projections range from 2.4% to 4.1% for the end of next year (not this year) and from 2% to 3% by the end of 2024.
It takes a long time to see a notable change in year-to-year inflation because each new month is averaged-in with eleven old months. If the monthly CPI did not increase at all in the next three months – zero – the year-to-year increase would nonetheless look “stubbornly high” at 7.3% in October, 6.4% in November and 5.9% in December. It would take continually falling prices to make any backwards-looking year-to-year average slow quickly
There are no Fed “targets” for any variety of CPI, only for the PCE. The Fed’s known problem with long lags is greatly magnified with the CPI because it is so heavily weighted toward shelter (rent). It becomes even more so if we focus on alternative indexes such as the center (median) of the weighted average, or if Fed watchers switch to leaving out energy prices opportunistically while they are going down (shelter is 40% of Core CPI).
“The weight on housing is 42% in the CPI, but just 23% in the PCE index,” finds a Brookings Institution paper. Shelter alone is a third of the CPI, double its weight in the PCE index.
A sensational Jason Furman article in September featured the Median CPI. “The scariest economics paper of 2022” by Lawrence Ball argued, in Furman’s words, that “underlying inflation is high and possibly rising. . . Median personal-consumption expenditure inflation [sic] shows no sign of moderating and has run at a 6.6% annual rate in the last three months.”
The figure Furman and Ball cited was median CPI (not “personal consumption expenditure”). It appears in one of Greg Ip’s graphs of alternative price indexes, up 7% from a year ago.
Paul Krugman’s tweeted response to Furman was that median CPI was nothing more than “owner’s equivalent rent” (OER) in disguise because median CPI is weighted. OER estimates account for shelter costs and 24% of the CPI, rent for 9%. Since rents account for a third of the CPI that puts them right in the middle (median).
Krugman’s debunking of median CPI as a Fed target led Furman to dig into the extended lags built into CPI shelter. Forbes reported the result:
The Bureau of Labor Statistics tracks the cost of shelter using all rents. That means it looks at leases already in effect or, somewhat subjectively, what homeowners would expect to pay if they wanted new digs. Instead, Furman swapped out that data for new rents, or “current asking prices” in civilian terms, as calculated by Zillow. This gauge shows a steep decline in the three-month change of core CPI since hitting a peak in July 2021.
“The housing market has cooled down a lot, but the official numbers that show everyone’s rent aren’t showing that yet,” Furman told Forbes.
In “Housing Costs May Continue To Rise Due To CPI Methodology,” Forbes columnist Simon Moore explains: “The CPI uses a panel approach to determine rental costs and all the prices are not sampled every month but using a six-month window across six of the housing panels. . . This means that the CPI estimate of shelter costs tends to follow the housing market but with a lag.”
Greg Ip adds, “Home prices fell in August by the most in a decade, and apartment rents fell in 80 of the 150 largest metropolitan areas in September, according to Jay Parsons of RealPage.”
The American Enterprise Institute finds, “Since [June] we have had [month-to-month] declines of 0.2%, 0.4%, & 0.5% in Jul., Aug., & Sep., respectively.” The S&P/Case-Shiller Home Price Index fell at an annual rate of 5.3% in July and 9.8% in August. But CPI and PCE indexes estimate the rental value of houses and condos to impute their implicit cost, regardless of when the homes were bought. Researchers at the Dallas Fed and Council of Economic Advisers estimate that it takes about 16-18 months for falling house prices to affect CPI estimates of shelter costs.
Since house prices fell every month in the Third Quarter, how could the cost of “Shelter” dominate all other non-shelter CPI prices (which were flat) in July, August, and September? If the Fed targets the 12-month CPI, as many assume, it does not matter how fast house prices fall because the CPI excludes house prices. As for rents, it takes many months for the Bureau of Labor Statistics to gradually patch together an outdated national average of old leases from vastly different and infrequently sampled metropolitan areas.
How raising interest rates is supposed to lower rents is an unsolved mystery. Mortgage rates that are now even higher than before the housing crash of 2007-08 make homeownership unaffordable for many, leading to more people bidding for scarce rental housing. Falling home sales and prices shrink homebuilding, making future housing scarcer and more expensive to own or rent.
Housing is responding as the Fed planned to higher interest rates, but that has only perverse effects on the actual cost of shelter while having little or no effect on our deeply flawed measures of the consumers’ cost of living.
One third of the CPI consists of an extremely lagged and misleading measure of rents and estimated owner equivalent rents.
The other two-thirds has been flat (zero) for three months.
dollar
inflation
monetary
markets
reserve
policy
interest rates
fed
monetary policy


Argentina Is One of the Most Regulated Countries in the World
In the coming days and weeks, we can expect further, far‐reaching reform proposals that will go through the Argentine congress.

Crypto, Crude, & Crap Stocks Rally As Yield Curve Steepens, Rate-Cut Hopes Soar
Crypto, Crude, & Crap Stocks Rally As Yield Curve Steepens, Rate-Cut Hopes Soar
A weird week of macro data – strong jobless claims but…

Fed Pivot: A Blend of Confidence and Folly
Fed Pivot: Charting a New Course in Economic Strategy Dec 22, 2023 Introduction In the dynamic world of economics, the Federal Reserve, the central bank…
