Economics
Can the S&P Surge 20%?
Today’s market price far outpaces earnings growth … will the consumer roll over in 2024 or prop up earnings growth? … analyzing bull/bear arguments…
Today’s market price far outpaces earnings growth … will the consumer roll over in 2024 or prop up earnings growth? … analyzing bull/bear arguments … tech vs oil valuations
In the long-run, stock prices reflect earnings.
If a company consistently generates more profit, the stock price will eventually reflect that.
On the other hand, if a stock price explodes higher, earnings must eventually reinforce those gains, or the house of cards will tumble.
Below, let’s look at the S&P’s earnings/price relationship here in 2023.
The S&P’s price is in green, its earnings are in black.
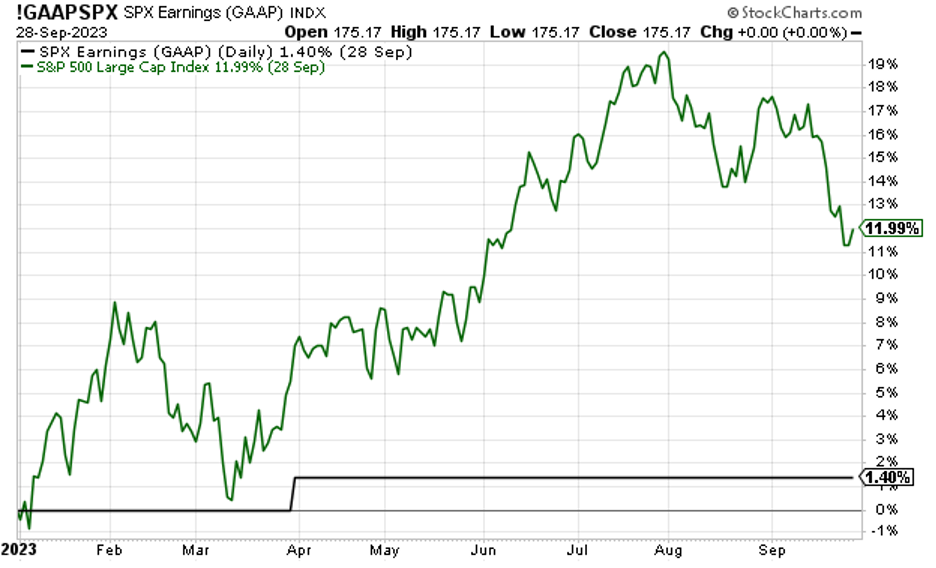 Source: StockCharts.com
Not exactly moving in lockstep.
This illustrates the point we’ve made in recent Digests – virtually all the S&P’s gains this year have come from investor enthusiasm and not earnings growth.
The big question for the S&P now is “what happens next?”
Will earnings ramp up to support today’s stock prices, or will stock prices fall in begrudging acceptance of underwhelming earnings?
In answering that, let’s go straight to the source of earnings – the U.S. consumer
You want to know how earnings will shape up?
Easy – how likely are people to continue opening their wallets?
To help us analyze this, let’s begin with the following piece of data from last Thursday that didn’t receive a great deal of fanfare.
From Bloomberg:
US consumer spending advanced at half the pace as previously reported in the second quarter, largely due to weaker services outlays, according to government figures published Thursday.
Personal consumption, the main driver of the US economy, rose an annualized 0.8% in the April-to-June period, according to the third estimate of gross domestic product from the US Bureau of Economic Analysis. That compared with 1.7% in the previous estimate and marked the weakest advance in over a year.
Fifty percent is a rather aggressive markdown from the government’s prior estimate.
Oh, but wait!
While we’re on the subject of government estimates that are way off the mark, let’s turn to another indicator of consumer health – their savings.
From a different Bloomberg article:
US households saved some $1.1 trillion less than previously thought over the past six years, according to revised government data released Thursday.
As part of a comprehensive update of some of the nation’s most-important economic statistics, the Bureau of Economic Analysis now calculates that Americans stashed away an average 8.3% of their disposable income annually from 2017 through 2022, down from a previously estimated 9.4%.
Now, while these data points certainly aren’t good news, they reference yesterday’s status (though they do suggest a downward trend extrapolated forward). So, what are forecasts about consumer spending and corporate earnings telling us about 2024?
Well, that’s where we run into the problem of mixed estimates.
Will 2024 bring contraction or growth?
The U.S. consumer accounts for roughly 70% of our economy. So, simplistically, our working assumption is “as the consumer goes, so goes the economy and corporate earnings.”
We can look at this in reverse too. If analysts are predicting strong corporate earnings, then they must also be anticipating a strong consumer.
With this assumption, let’s begin with a bullish perspective. From FactSet’s latest Earnings Insight last Friday:
For Q1 2024, analysts are projecting earnings growth of 8.6% and revenue growth of 4.7%.
For Q2 2024, analysts are projecting earnings growth of 12.1% and revenue growth of 5.5%.
For CY 2024, analysts are projecting earnings growth of 12.2% and revenue growth of 5.6%.
For context, YCharts reports that the average S&P earnings growth rate is 9.03%.
Therefore, these analysts predict consumer spending will be robust enough to support not just “average” earnings growth next year, but well above average growth.
The FactSet piece didn’t detail the reasoning behind this assumed consumer strength. But Goldman Sachs is also bullish on the U.S. consumer next year, so let’s borrow their explanation.
Here’s Goldman’s chief economist Jan Hatzius:
At a macro level, if there was only one indicator that I could know regarding the consumer, it would be real disposable household income, and that has been growing at a 4% pace in 2023.
We think 2024 is going to be a little weaker, but we’re still expecting about 3% real disposable household income growth.
If that’s right, or even if that’s anywhere close to right, then it’s very difficult to see declines in real consumer spending.
This 4% growth Hatzius is referencing is year-over-year growth. But without greater context, it’s a bit misleading.
Is real disposable income really that strong?
Last year’s real disposable income numbers were woefully low, so the 2023 growth Hatzius references is more a function of a lower baseline starting level than anything else.
To illustrate, below, we look at “Real Disposable Income” from the Federal Reserve.
First, we’ve added a trendline to show you where real disposable income would be today without the inflationary influence of the pandemic if we’d continued along the multi-year trendline. This is in green. We’re well-below it today.
Second, notice that the latest trend with real disposable income is down, not up.
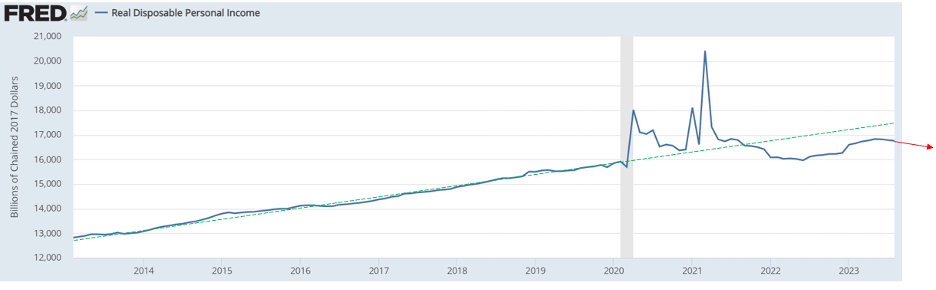 Source: Federal Reserve data
To help you see this recent change in direction easier, here’s the data from January of this year through August (the most recent numbers we have).
From January through May, we saw real growth of just 1.37%, and it’s been falling since.
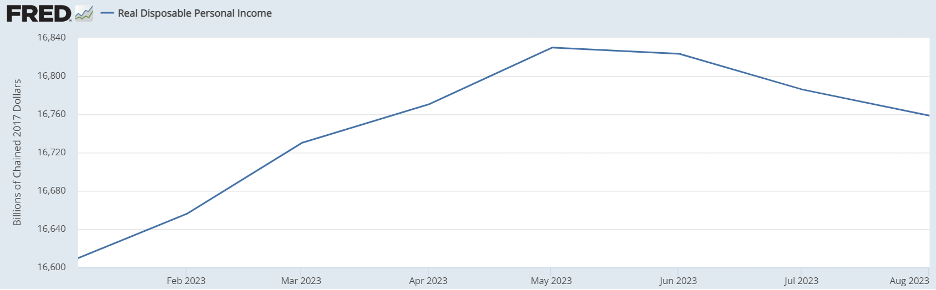 Source: Federal Reserve data
And here’s the real monthly change from the Bureau of Economic Analysis from May through August:
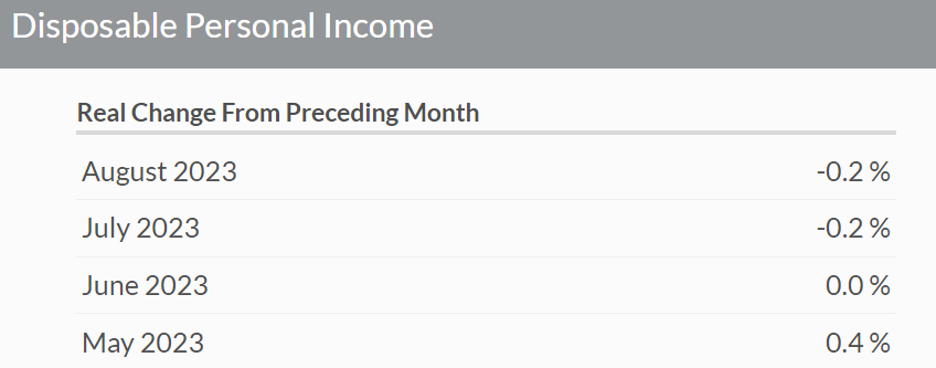 Source: Bureau of Economic Analysis
To me, this deeper dive into the data calls into question this bullish disposable income argument.
What’s the bearish outlook for the consumer?
Let’s turn to Fitch from last week:
U.S. consumer spending has been remarkably resilient… however, we expect a marked slowdown in spending from 4Q23 as the labor market cools, wage growth slows, the boost to consumption from excess savings wanes and the lagged effect of the Fed’s aggressive tightening cycle bites even more…
…We expect real spending to slow to an annualized rate of 1.2% in 4Q23 and contract by 0.8% in 1Q24 and 3% in 2Q24.
The resumption of student loan payments in Q423 is likely to modestly dampen consumption by less than 10 bps…
…Wage income – the dominant driver of household income dynamics – looks set to slow as employment and wage growth weaken.
So, not only does Fitch not see robust consumer/earnings growth, but it also sees a 3% consumer contraction.
Clearly, we have conflicting outlooks, and disagreements are not uncommon, so let’s arrive at our conclusion a different way.
Rather than try to pinpoint what the reality will be next year, let’s try to rule out what it won’t be.
The FactSet analysis we looked at earlier shows that for calendar year 2024, analysts project earnings growth of 12.2%. And remember, we contextualized this number by adding that the average S&P earnings growth rate is 9.03%.
While we don’t know where earnings will come in, the projected “well above average” earnings growth rate seems unlikely given how some analysts project a consumer spending contraction next year.
Why does the answer matter?
Because it ties into forecasts for where the stock market will go next year. And that brings us back to the beginning of today’s Digest – the relationship between earnings and stock prices.
If earnings growth underwhelms next year, that leaves today’s market price in a precarious position
Once again, here’s the chart from the top of today’s Digest showing the S&P racing higher this year while earnings have done nothing.
Source: StockCharts.com
Meanwhile, according to FactSet, analysts’ bottom-up price target for the S&P 500 over the next 12 months is 5,148. This represents a 20% surge over the next 12 months based on the S&P’s price as I write Monday morning.
This bullish forecast is based on those “above average” earnings we just looked at. But if earnings disappoint next year as U.S. consumers finally close their wallets and hunker down, a 20% gain seems unachievable – unless it’s achieved purely through rabidly bullish investor sentiment.
But let’s get some perspective on that. Remember, the S&P is up 11.5% here in 2023, and this gain has come exclusively from investor sentiment, not earnings.
Are investors truly so amped up today that they’ll drive the market another 20% higher over the next 12 months even if the U.S. consumer rolls over and earnings underwhelm?
Sure, it could happen, but without real earnings growth that’s a tough bet to take.
Before we sign off, keep in mind where you’re investing and the level of earnings you’re getting in return
In Friday’s Digest, we urged readers to be careful about the AI sector finally coming back to earth after its valuations have climbed into the stratosphere this year.
From that Digest:
AI investors would be wise to remember that a study of stock market history shows, time and again, that when it comes to valuations, gravity always wins.
Well, relating to our discussion today of earnings and prices, here’s something to keep in mind…
Recent research from the quant shop Ned Davis compared the energy and tech sectors, looking at their respective market caps and earnings.
Remember that market cap is a measure of a company’s value based on the number of outstanding common stock shares multiplied by the stock price. It’s a measure of a company’s valuation, in part based on how popular the stock is (since investors “vote” by buying it, bidding up the share price).
You would think the bigger the market cap, the greater the earnings.
Not so much.
As you can see below, enthusiastic investors have flooded into tech this year. Relative to earnings, tech valuations are offering a far worse deal for investors than, say, energy.
Take a look…
Energy sector earnings as a percentage of the S&P: 11%
Energy sector market cap as a percentage of the S&P: 4%
Tech sector earnings as a percentage of the S&P: 18%
Tech sector market cap as a percentage of the S&P: 29%
So, as a crude “market cap to earnings” comparison, here’s how this sums up, with a higher value meaning “you’re paying more for less”:
Energy: 36%
Tech: 161%.
Bottom line: earnings matter.
They matter for the tech sector… they matter for the broad S&P… and they matter for your portfolio.
And since earnings come from the U.S. consumer, that’s where your eye needs to be going into next year. As they go, so goes the S&P…eventually.
Have a good evening,
Jeff Remsburg
More From InvestorPlace
- ChatGPT IPO Could Shock the World, Make This Move Before the Announcement
- Musk’s “Project Omega” May Be Set to Mint New Millionaires. Here’s How to Get In.
- The Rich Use This Income Secret (NOT Dividends) Far More Than Regular Investors
The post Can the S&P Surge 20%? appeared first on InvestorPlace.


Argentina Is One of the Most Regulated Countries in the World
In the coming days and weeks, we can expect further, far‐reaching reform proposals that will go through the Argentine congress.

Crypto, Crude, & Crap Stocks Rally As Yield Curve Steepens, Rate-Cut Hopes Soar
Crypto, Crude, & Crap Stocks Rally As Yield Curve Steepens, Rate-Cut Hopes Soar
A weird week of macro data – strong jobless claims but…

Fed Pivot: A Blend of Confidence and Folly
Fed Pivot: Charting a New Course in Economic Strategy Dec 22, 2023 Introduction In the dynamic world of economics, the Federal Reserve, the central bank…
