Economics
Become a Better Trader By Doing This
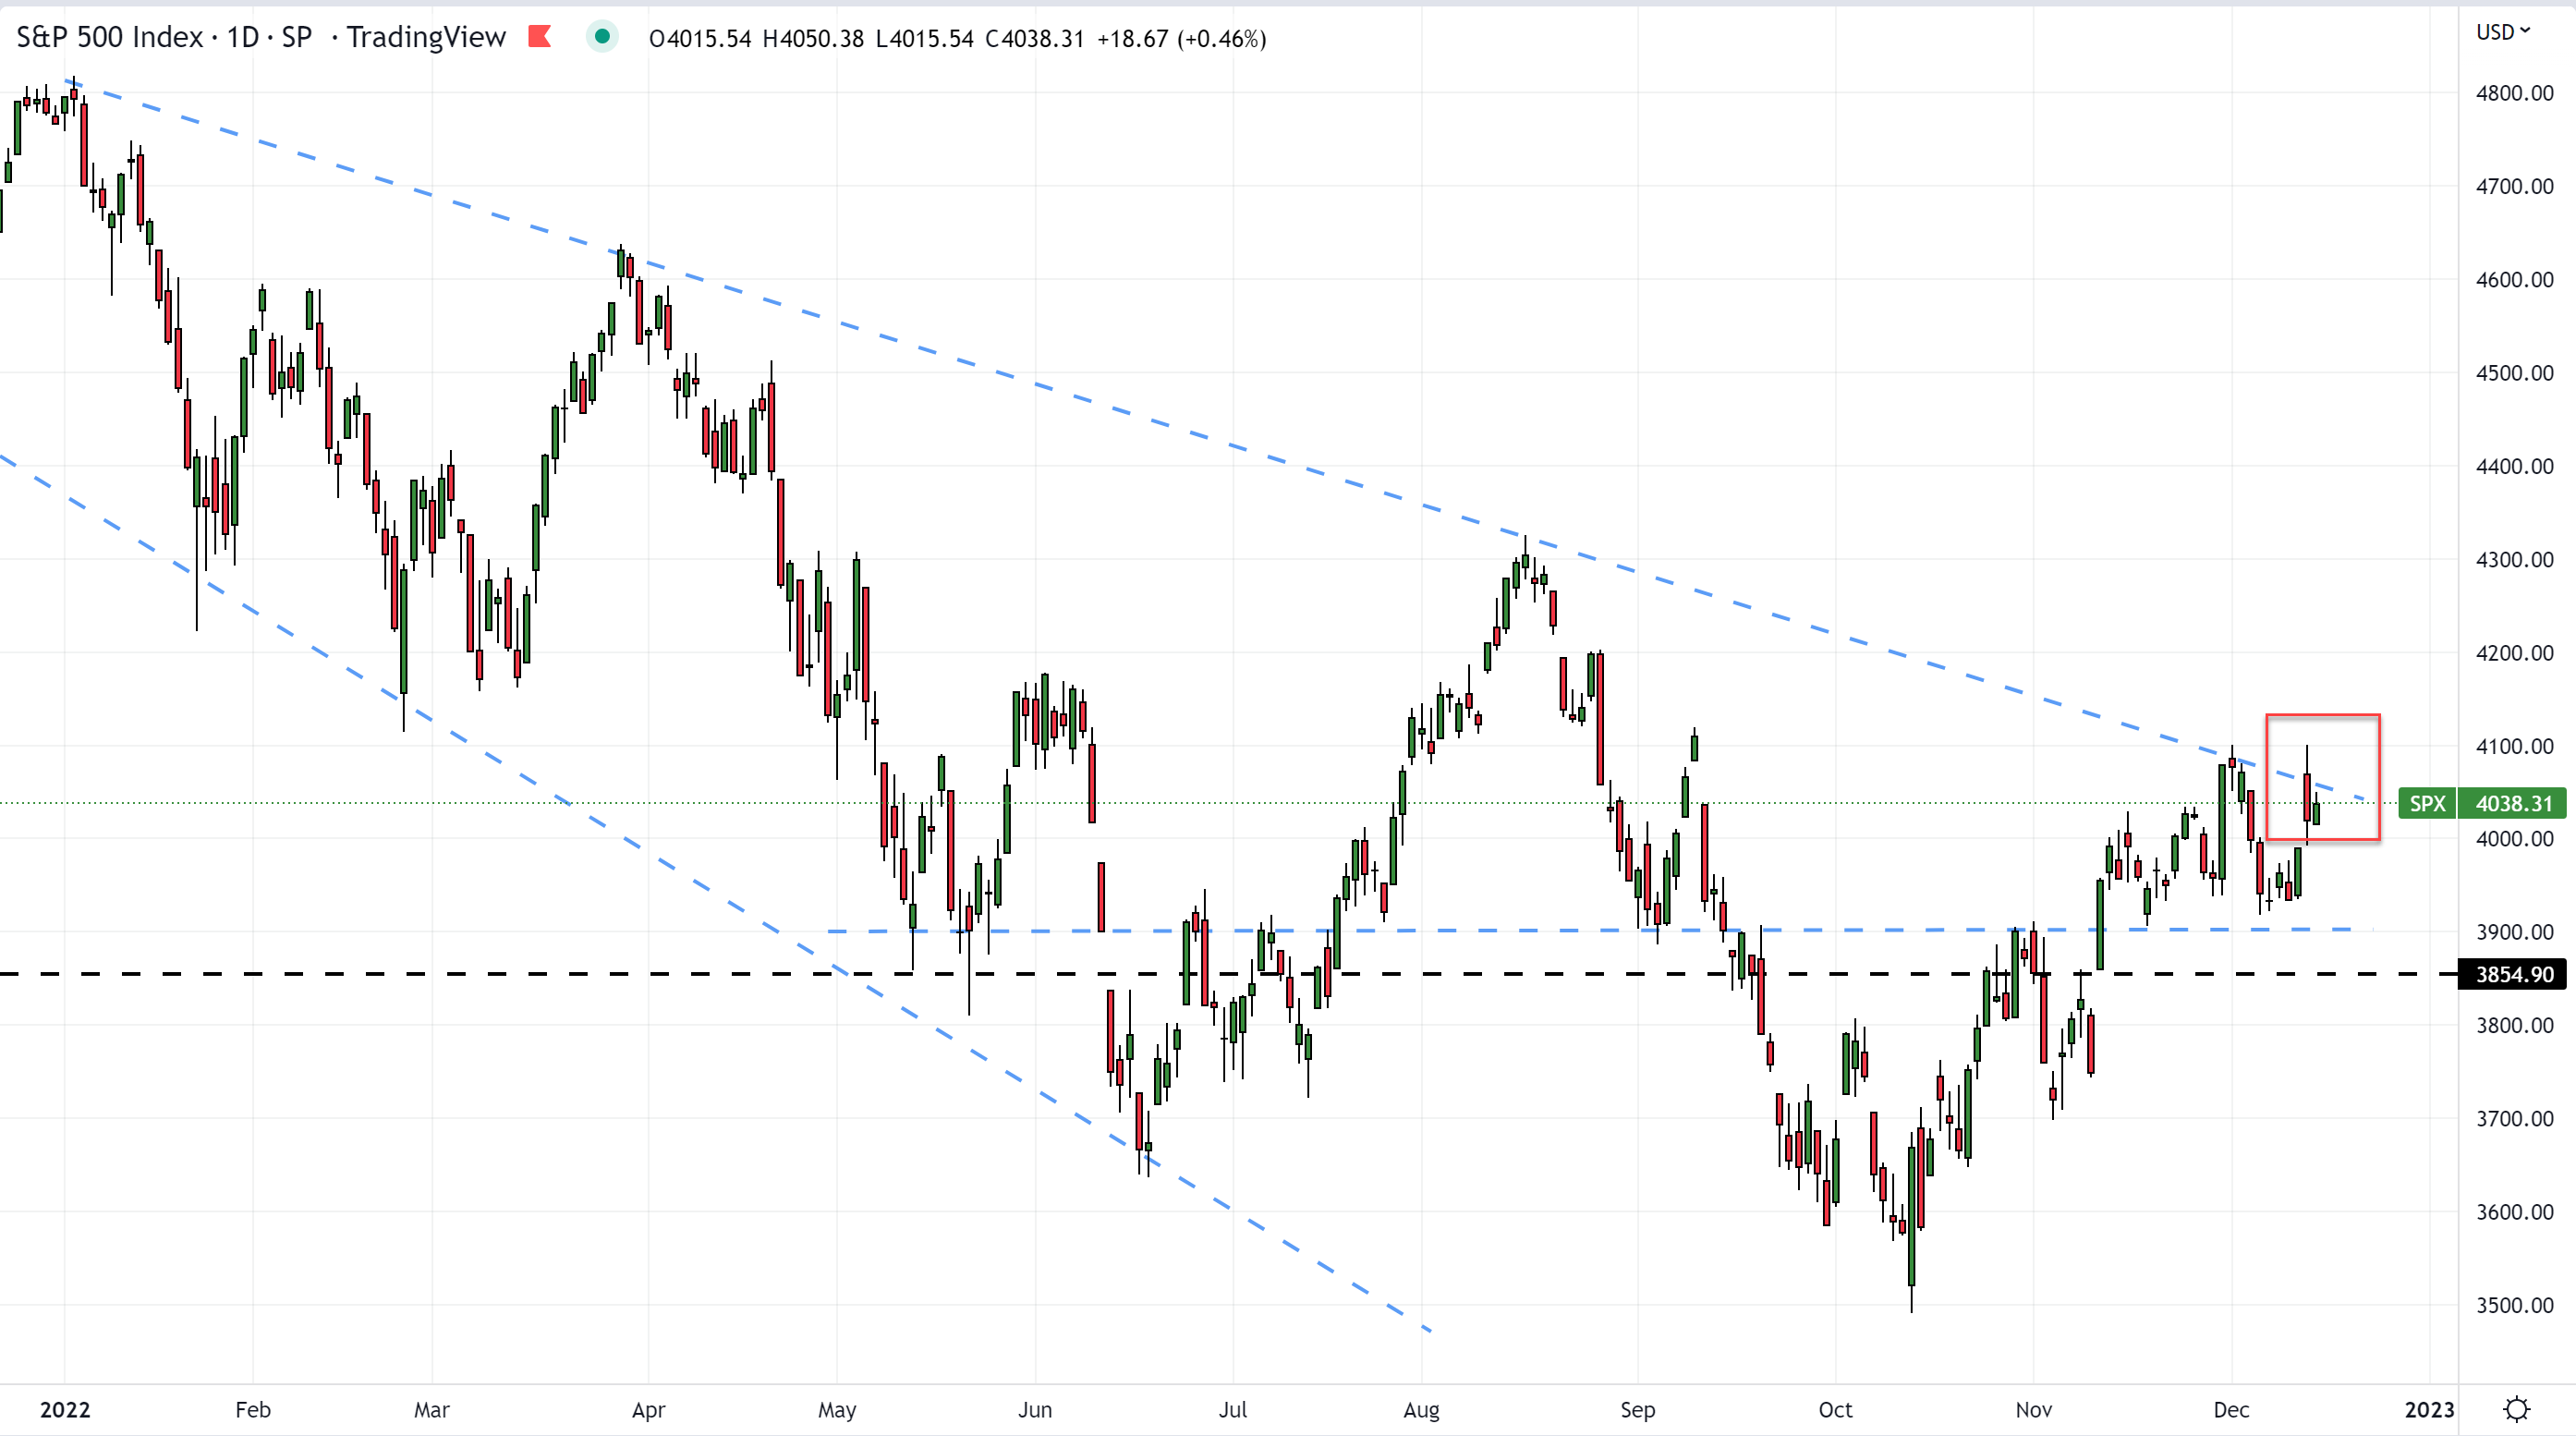
The S&P 500 is on the cusp of breaking up through the down-trending resistance level that has been keeping the index down since the beginning of 2022…

The S&P 500 is on the cusp of breaking up through the down-trending resistance level that has been keeping the index down since the beginning of 2022 (see below).
We’ve finally come to this point because Wall Street’s expectations of how aggressively the Federal Reserve is going to continue hiking interest rates are changing.
You can tell they are adjusting their monetary-policy expectation because they aren’t pushing Federal (Fed) Funds futures contracts lower.
We’re going to get a little bit nerdy here, but we promise you’ll be a better trader for it in the end…
What This All Means
Too many stock and options traders believe they only need to pay attention to the stock market when they’re trading. However, there is so much we can learn from other financial markets.
For example, you may never trade a futures contract in your life, but learning how to watch the Fed Funds futures market for clues about what traders expect to happen with interest rates in the coming months will make you a better stock and options trader.
Fed Funds futures contracts are priced off a baseline of 100 and move up and down based on where traders believe the Federal Open Market Committee (FOMC) is going to set its target interest rate in the future.
- If traders believe the FOMC is going to cut rates, they push the prices of Fed Funds futures contracts higher.
- Conversely, if traders believe the FOMC is going to raise rates, they push the prices of Fed Funds futures contracts lower.
Now, let’s get back to what’s happening in the stock market…
The S&P 500 is still trading just above bear-market territory. However, the landscape is changing in the global economy.
The Bureau of Labor Statistics (BLS) just announced that the Consumer Price Index (CPI) slowed down to an annual growth rate of 7.1% last month. This is still an incredibly high level of inflation, but the fact that the rate of inflationary growth is slowing is a sign that the dramatic action the FOMC has taken during 2022 is starting to have an impact.
Wall Street is now starting to wonder if this means the FOMC will be. less aggressive with its monetary policy in 2023, which would be great news for the stock market.
We know Wall Street is wondering because traders are starting to make moves in the Fed Funds futures market.
Louis Navellier, Eric Fry, and Luke Lango just dropped a bombshell on their readers. They say 99% of the population is clueless about the major events about to rock the markets in early 2023. This is the #1 thing they believe you MUST do before Jan. 1, 2023.
Tracking Fed Funds Futures Contracts
Our favorite way to track Fed Funds futures contracts is with the CME FedWatch Tool. This tool shows you the probabilities of an FOMC rate hike, or rate cut, that traders are pricing into the Fed Funds futures contracts.
For example, in the runup to Wednesday’s FOMC Monetary Policy meeting, the CME FedWatch Tool was showing that traders had priced in a 100% expectation that the FOMC would not raise rates then. You can see this below.
CME FedWatch Tool – Dec. 14, 2022 FOMC Monetary Policy Meeting
Here’s how you read the data…
This is exactly what happened. The FOMC raised rates by 0.50% today. Here is the excerpt from today’s monetary policy statement…
The Committee seeks to achieve maximum employment and inflation at the rate of 2 percent over the longer run. In support of these goals, the Committee decided to raise the target range for the federal funds rate to 4-1/4 to 4-1/2 percent.
However, expectations for what the FOMC is going to do during 2023 are changing, and those changes are showing up in the CME FedWatch Tool.
If you look at the chart for the Dec. 13, 2023 meeting below, you can see the differences.
CME FedWatch Tool – Dec. 13, 2023 FOMC Monetary Policy Meeting
Why are stock traders excited about this trend?
They are excited because they know that lower interest rates have the potential to encourage stock growth and potentially lead to a further bullish recovery in the stock market.
That’s why today’s FOMC Monetary Policy meeting is so important. Everyone is waiting to see if the FOMC is going to signal higher interest rates long-term, or lower interest rates.
Tracking the FOMC
So how exactly does the FOMC signal its monetary policy intentions? It updates it “dots.”
You see, the FOMC releases updated economic projections at every other Monetary Policy meeting. The last time it updated its projections was at its Sept. 21, 2022 meeting.
In those projections, the FOMC published its “Dot Plot” (see Fig. 4) that showed where each of the 17 members of the committee believed the target rate would be at the end of each of the next few years.
FOMC Dot Plot (source: Summary of Economic Projections – Sept. 21, 2022)
This “Dot Plot” showed us that…
That was an incredibly strong indication that the FOMC was going to raise and leave rates high for a long time. Wall Street was disappointed by this because high interest rates usually mean weaker economic growth and lower stock prices.
So what did the “Dot Plot” from today’s meeting (see Fig. 5) tell us?
FOMC Dot Plot (source: Summary of Economic Projections – Dec. 14, 2022)
Looking at the chart you can see that…
This shows us that members of the FOMC believe interest rates are going to be much higher by the end of next year than had been priced in by Wall Street in the Federal Funds futures market. That means traders are going to have to make some adjustments to their expectations. These adjustments will likely be bearish for the stock market.
The Bottom Line
It doesn’t look like today is going to be the day that the S&P 500 breaks above its long-term down-trending resistance level.
We’ll be watching to see if the index can hold above support at 3,900. If it can, the S&P 500 may have another opportunity for a bullish breakout.
Sincerely,
John and Wade
P.S. Three Free Recession-Proof Stocks for 2023
Legendary Growth Investors Louis Navellier, Eric Fry, and Luke Lango just revealed 3 FREE recession-proof stock picks for 2023. Get the name and ticker symbols here.
The post Become a Better Trader By Doing This appeared first on InvestorPlace.
inflation
monetary
markets
reserve
policy
interest rates
fed
monetary policy
inflationary

Argentina Is One of the Most Regulated Countries in the World
In the coming days and weeks, we can expect further, far‐reaching reform proposals that will go through the Argentine congress.
Crypto, Crude, & Crap Stocks Rally As Yield Curve Steepens, Rate-Cut Hopes Soar
Crypto, Crude, & Crap Stocks Rally As Yield Curve Steepens, Rate-Cut Hopes Soar
A weird week of macro data – strong jobless claims but…
Fed Pivot: A Blend of Confidence and Folly
Fed Pivot: Charting a New Course in Economic Strategy Dec 22, 2023 Introduction In the dynamic world of economics, the Federal Reserve, the central bank…


