Economics
Bank Funding during the Current Monetary Policy Tightening Cycle
Recent events have highlighted the importance of understanding the distribution and composition of funding across banks. Market participants have been…

Recent events have highlighted the importance of understanding the distribution and composition of funding across banks. Market participants have been paying particular attention to the overall decline of deposit funding in the U.S. banking system as well as the reallocation of deposits within the banking sector. In this post, we describe changes in bank funding structure since the onset of monetary policy tightening, with a particular focus on developments through March 2023.
Trends in Aggregate Deposits and Borrowings
We begin by describing the cumulative change in bank deposit funding and other sources of bank borrowing since the start of monetary policy tightening in March 2022. Aggregated data on commercial bank balance sheets is provided by the Federal Reserve to the public on a weekly basis in the H.8 release—Assets and Liabilities of Commercial Banks in the United States. The “deposit” line-item pools all deposit types irrespective of maturity and counterparty. “Borrowing” pools various sources of bank wholesale funding, such as advances from Federal Home Loan Banks (FHLBs), other types of wholesale borrowings in the private market, and credit extended by the Federal Reserve.
Banks Have Replaced Deposit Funding with Other Borrowing
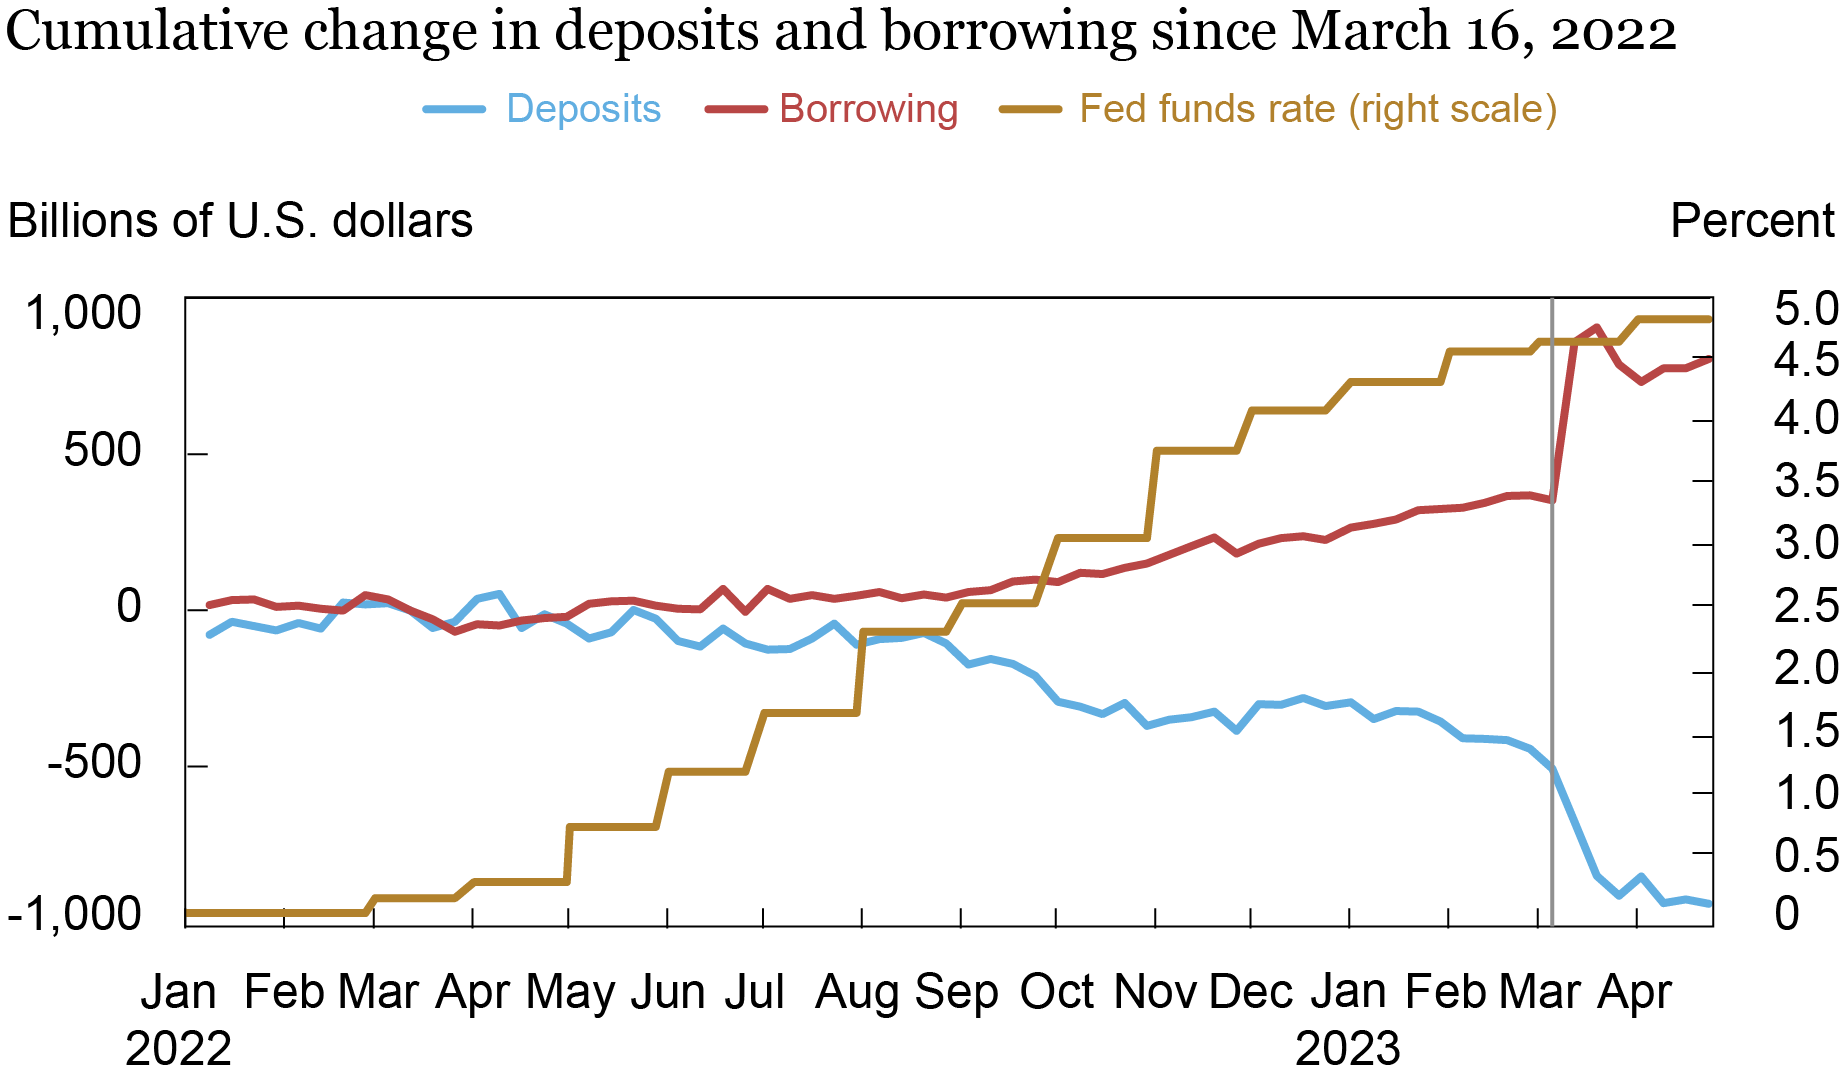
The chart above reveals that deposit funding gradually declined by around $500 billion over the year ending in early March 2023 as the fed funds target rate rose. The initial decline is at least in part due to the fact that banks increase deposit rates more slowly than the federal funds rate, making deposits relatively unattractive for some depositors, as discussed in prior posts. Significant deposit inflows during the COVID period likely exacerbated this effect. Over the few weeks prior to the FDIC receivership announcements on March 10 and 12, the banking sector lost another approximately $450 billion. Throughout, the banking sector has offset the reduction in deposit funding with an increase in other forms of borrowing which has increased by $800 billion since the start of the tightening.
Deposit Flows Across the Bank Size Distribution
To explore the heterogeneity underlying the aggregate trends, we leverage data collected in form FR 2644, the microdata used to construct the aggregates observed in the H.8 release. The data are an unbalanced panel that consists of a random stratified sample of roughly 850 banks and participation is voluntary. We segment the data into more granular cohorts than the public H.8 release: small banks (less than $5 billion in total domestic assets), regionals ($5 to $50 billion), super-regionals ($50 to $250 billion), and large banks (greater than $250 billion).
The right panel of the chart below summarizes the cumulative change in deposit funding by bank size category since the start of the tightening cycle through early March 2023 and then through the end of March. Until early March 2023, the decline in deposit funding lined up with bank size, consistent with the concentration of deposits in larger banks. Small banks lost no deposit funding prior to the events of late March. In terms of percentage decline, the outflows were roughly equal for regional, super-regional, and large banks at around 4 percent of total deposit funding.
Deposits Flowed from Super-Regional Banks to Large Banks following the Run on Silicon Valley Bank
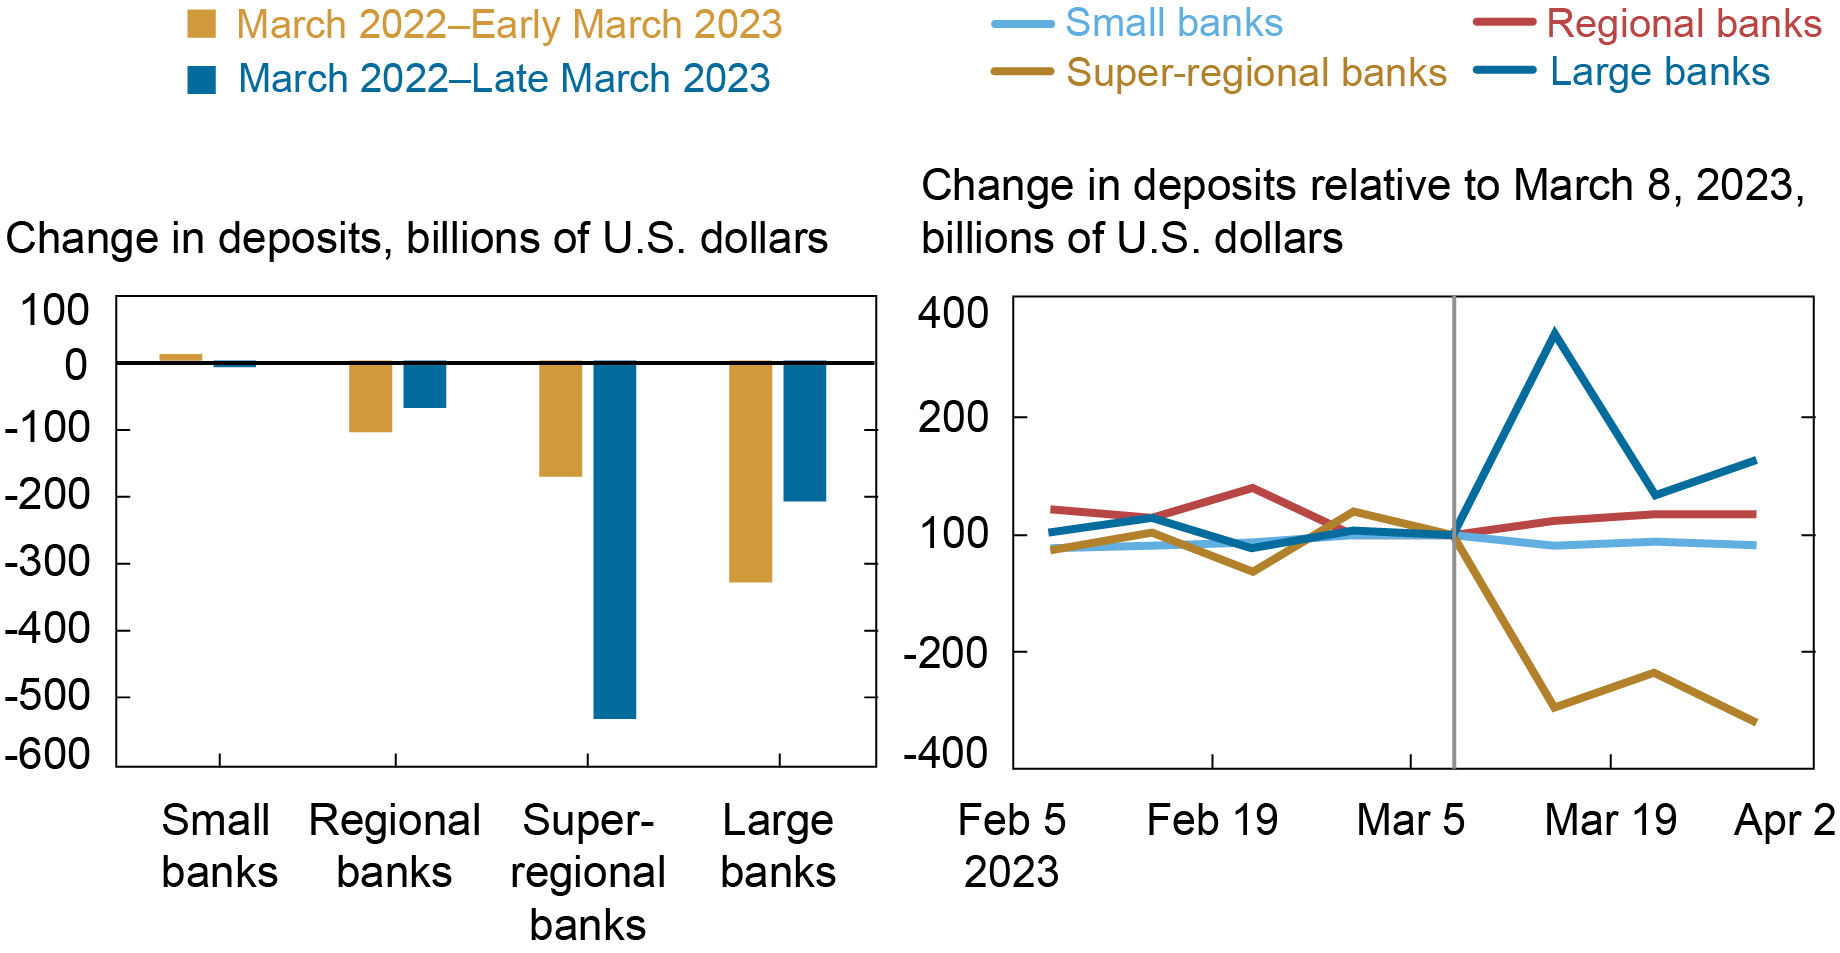
Notes: Banks are categorized by the size of their domestic assets: small banks—less than $5 billion; regional banks—$5 to $50 billion; super-regional banks—$50 to $250 billion; large banks—greater than $250 billion.
The blue bar in the left panel shows that the pattern changes following the run on SVB. The additional outflow is entirely concentrated in the segment of super-regional banks. In fact, most other size categories experience deposit inflows. The right panel illustrates that outflows at super-regionals begin immediately after the failure of SVB and are mirrored by deposit inflows at large banks in the second week of March 2022. Further, while deposit funding remains at a lower level throughout March for super-regional banks, the initially large inflows mostly reverse by the end of March. Notably, banks with less than $100 billion in assets were relatively unaffected.
We study the destination of funds flowing out of super-regional banks using Fedwire data, which capture depository institutions as well as a number of other participants (for example, FHLBs, domestic financial market utilities, and the U.S. Treasury). The chart below shows significant net cash transfers from regionals to large banks over a roughly three-day period in March. Altogether, the patterns indicate that some depositors initially shift their holdings to larger banks in the immediate aftermath of the SVB receivership announcement, but invest outside of the banking system soon thereafter, thus contributing to the aggregate outflow of deposits in March.
Net Payments by Regional Banks to Other Institutions, Based on Fedwire Funds Data
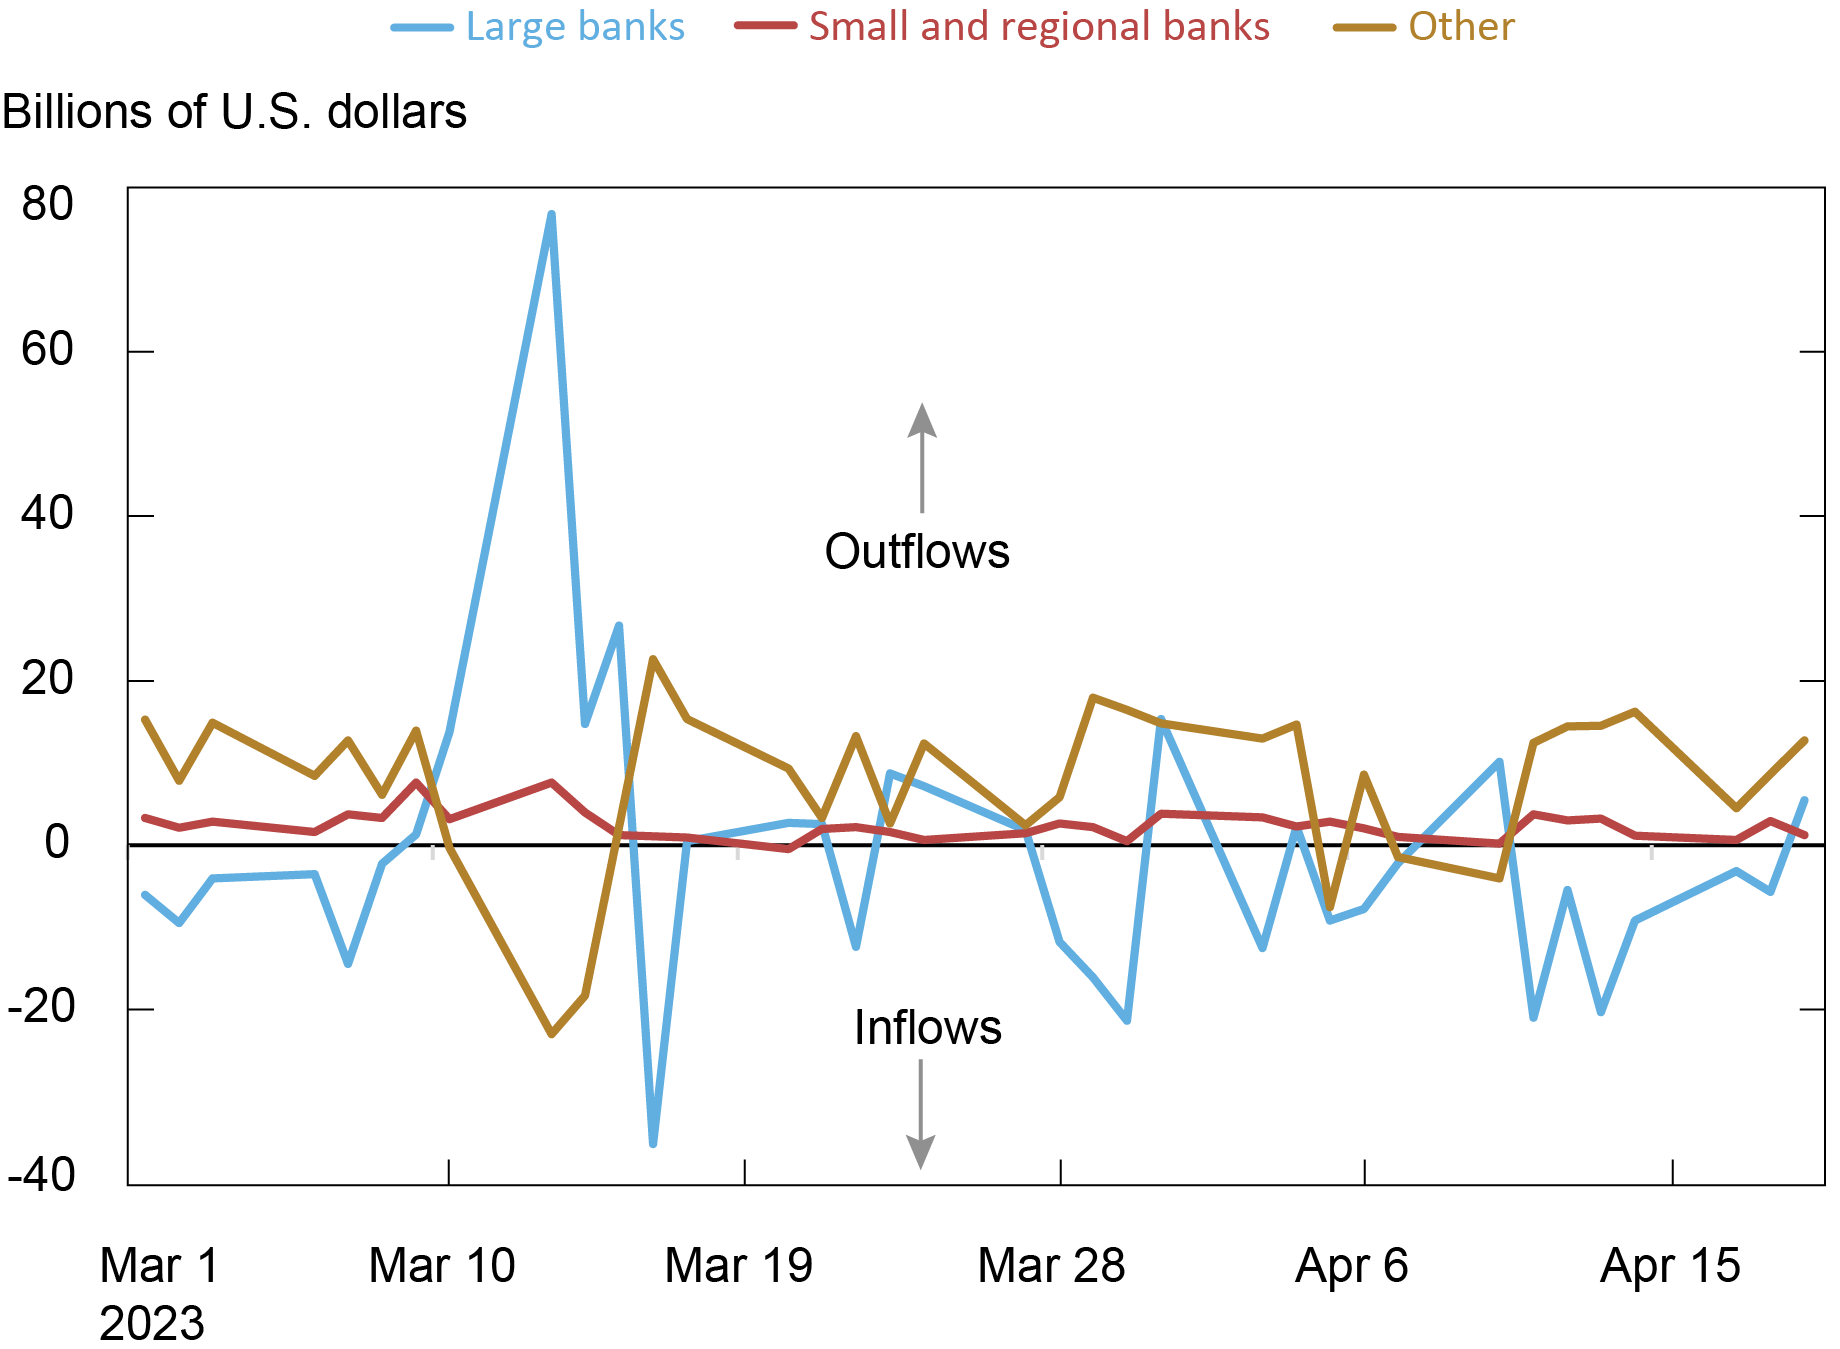
Notes: “Other” includes DFMUs, GSEs, the Treasury General Account, and other accounts held by non-depository institutions. Banks are categorized by the size of their domestic assets: small and regional banks—less than $50 billion; large banks—greater than $250 billion.
A Search for Precautionary Liquidity
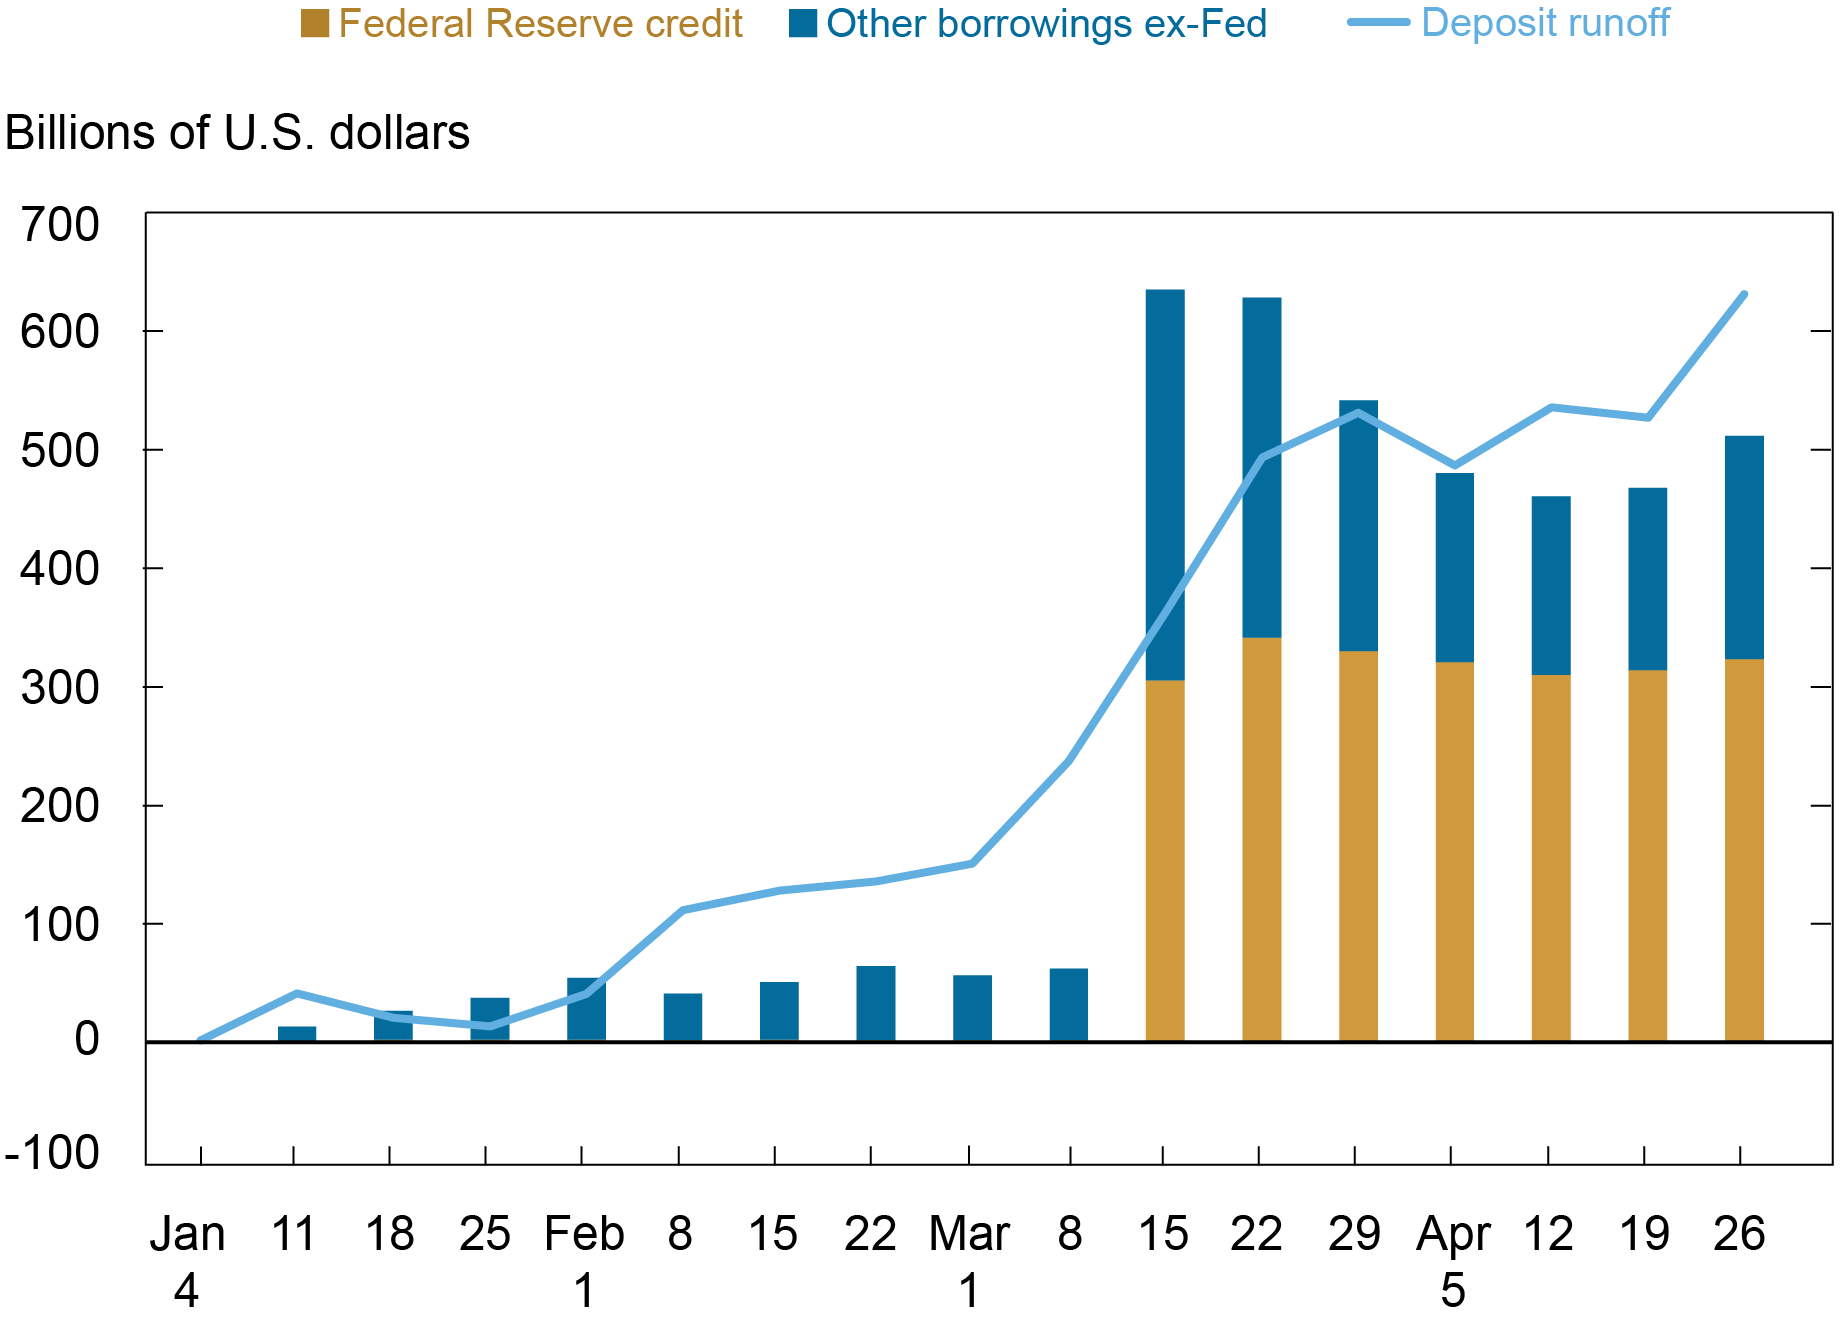
Next, we investigate how banks raise funding to replace deposits that are leaving the banking system. We first combine consolidated commercial bank balance sheet data with the Fed’s H.4.1 release (Factors Affecting Reserve Balances), which, among other items, discloses extensions of credit by Reserve banks. Prior to the failure of SVB, new borrowing did not fully offset deposit runoff, consistent with banks having excess funding following the deposit inflows experienced during COVID. However, during the most acute phase of banking stress in mid-March, other borrowings exceeded reductions in deposit balances, suggesting significant and widespread demand for precautionary liquidity. A substantial amount of liquidity was provided by the private markets, likely via the FHLB system, but primary credit and the Bank Term Funding Program (both summarized as Federal Reserve credit) were equally important.
Deposit Runoff versus Other Borrowings for Domestically Chartered Commercial Banks in the U.S.
Change since January 4, 2023
In the chart below, we show that prior to March, large banks increased borrowing the most, which is in line with deposit outflows being strongest for larger banks before March 2023. During March 2023, both super-regional and large banks increase their borrowings, with most increases being centered in the super-regional banks that faced the largest deposit outflows. Note, however, that not all size categories face deposit outflows but that all except the small banks increase their other borrowings. This pattern suggests demand for precautionary liquidity buffers across the banking system, not just among the most affected institutions.
Borrowings before and after the Failure of SVB
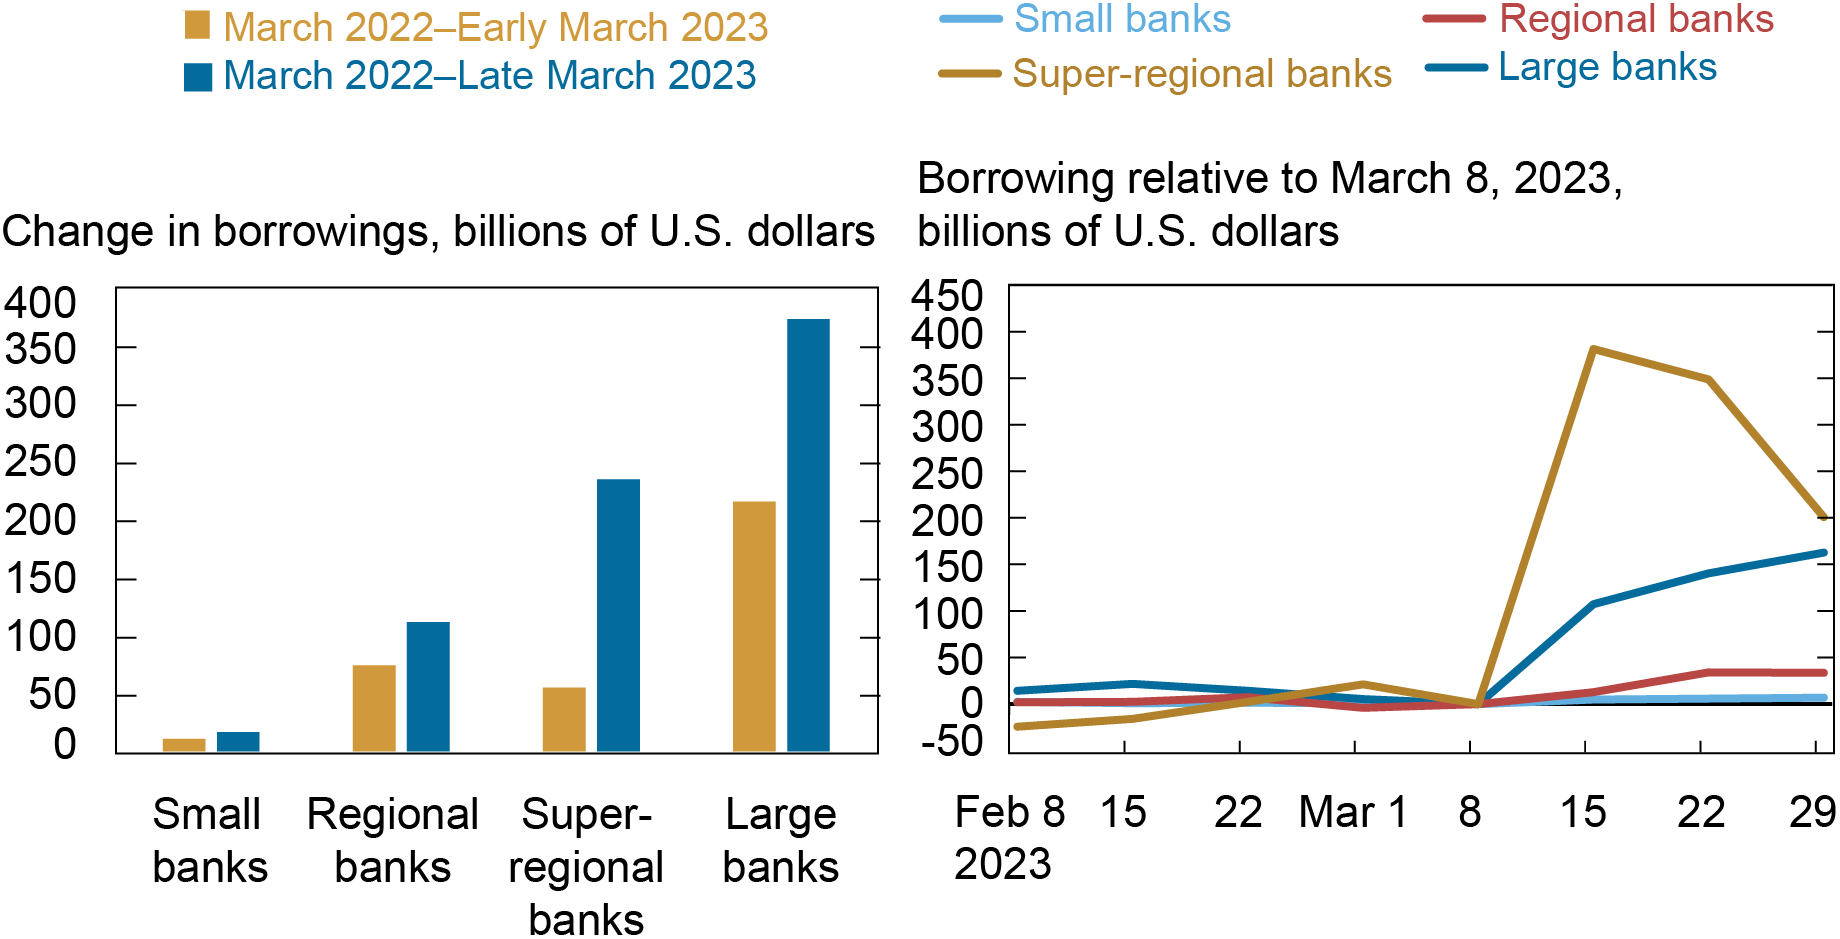
Notes: Banks are categorized by the size of their domestic assets: small banks—less than $5 billion; regional banks—$5 to $50 billion; super-regional banks—$50 to $250 billion; large banks—greater than $250 billion.
Wrapping Up
We show that the banking system has seen a considerable decline in deposit funding since the start of the current monetary policy tightening cycle in March 2022. The speed of deposit outflows increased during March 2023, following the run on SVB, with the most acute outflows concentrated in a relatively narrow segment of the banking system, super-regional banks (those with $50 to $250 billion in total assets). Notably, deposit funding amongst the cohort often referred to as community and smaller regional banks (that is, institutions with less than $50 billion in assets) were relatively stable by comparison. Large banks (those with more than $250 billion in assets), which had been subject to the largest deposit outflows before March 2023, received deposit inflows throughout March 2023. Throughout, banks were able to replace deposit outflows by making use of alternative funding sources.
Stephan Luck is a financial research advisor in Banking Studies in the Federal Reserve Bank of New York’s Research and Statistics Group.
Matthew Plosser is a financial research advisor in Banking Studies in the Federal Reserve Bank of New York’s Research and Statistics Group.

Josh Younger is a policy and market analysis advisor in the Federal Reserve Bank of New York’s Markets Group.
How to cite this post:
Stephan Luck, Matthew Plosser, and Josh Younger, “Bank Funding during the Current Monetary Policy Tightening Cycle,” Federal Reserve Bank of New York Liberty Street Economics, May 11, 2023, https://libertystreeteconomics.newyorkfed.org/2023/05/bank-funding-during-the-current-monetary-policy-tightening-cycle/.


Disclaimer
The views expressed in this post are those of the author(s) and do not necessarily reflect the position of the Federal Reserve Bank of New York or the Federal Reserve System. Any errors or omissions are the responsibility of the author(s).


Argentina Is One of the Most Regulated Countries in the World
In the coming days and weeks, we can expect further, far‐reaching reform proposals that will go through the Argentine congress.

Crypto, Crude, & Crap Stocks Rally As Yield Curve Steepens, Rate-Cut Hopes Soar
Crypto, Crude, & Crap Stocks Rally As Yield Curve Steepens, Rate-Cut Hopes Soar
A weird week of macro data – strong jobless claims but…

Fed Pivot: A Blend of Confidence and Folly
Fed Pivot: Charting a New Course in Economic Strategy Dec 22, 2023 Introduction In the dynamic world of economics, the Federal Reserve, the central bank…


