Economics
Back The Market Over The Fed In Who’s Right On Recession
Back The Market Over The Fed In Who’s Right On Recession
Authored by Simon White, Bloomberg macro strategist,
The Fed continues to maintain…
Back The Market Over The Fed In Who’s Right On Recession
Authored by Simon White, Bloomberg macro strategist,
The Fed continues to maintain its hawkish stance and a desire to keep rates higher for longer. However, the weight of history lies with the market which, through the medium of the yield curve, is sending the message that a potentially deep recession – requiring steep rate cuts – is on the way.
The mantra from many at the Fed continues to be to keep rates high, perhaps above 5%, and keep them there for an extended period. But the market is not really listening. The peak expected fed funds rate was 5.14% on November 3rd last year and has not been higher since.
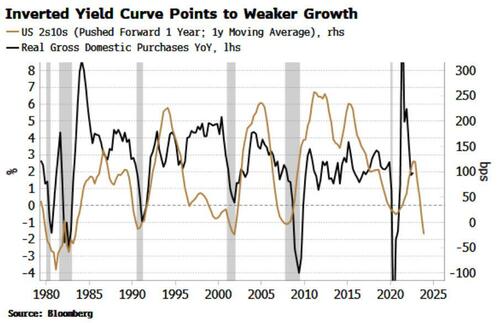
Longer-term yields have been falling too, leading to the most inverted yield curve since the 1980s.
Much discussed is the yield-curve’s ability to predict recessions, but it also leads the ups as well as the downs in growth, by around one year. As the chart below shows, the yield curve is pointing to a potentially quite steep fall in growth.
There is overall a modestly positive relationship between the maximum yield-curve inversion before a recession and the subsequent peak fall in real GDP growth. The usual caveat applies with recession analysis in that the sample size is necessarily small, but nonetheless we can see that in general, steeper yield-curve inversions tend to precede deeper recessions.
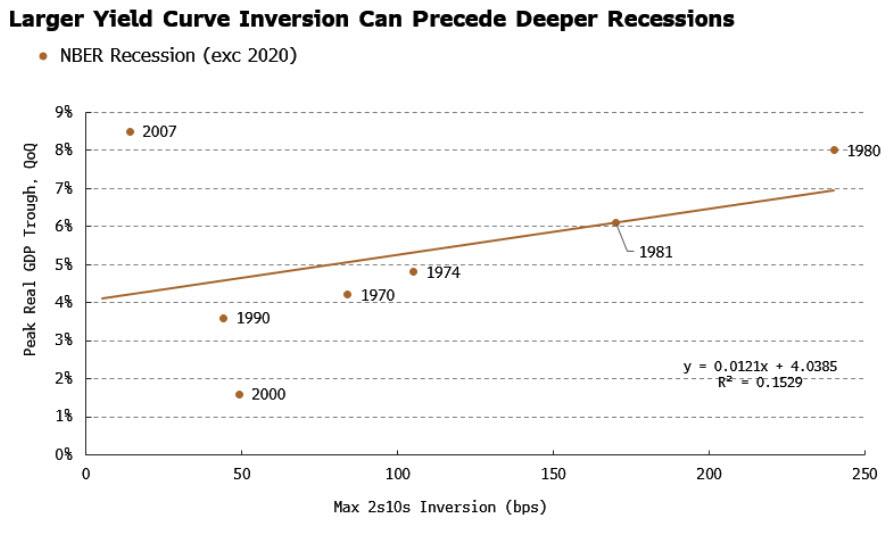
Excluding the 2000 and 2007 recessions increases the correlation between the peak GDP trough and maximum curve inversion, leaving the 1970s and 1980s inflationary recessions that are more relevant to today’s backdrop.
There is an even stronger relationship between the depth of the curve inversion before a recession and the total size of the subsequent Fed cutting cycle. This suggests that it is how much “room” the Fed has to cut – gauged by how inverted the yield curve is – rather than how deep the recession proves to be, that is the ultimate arbiter of the size of the cutting cycle.
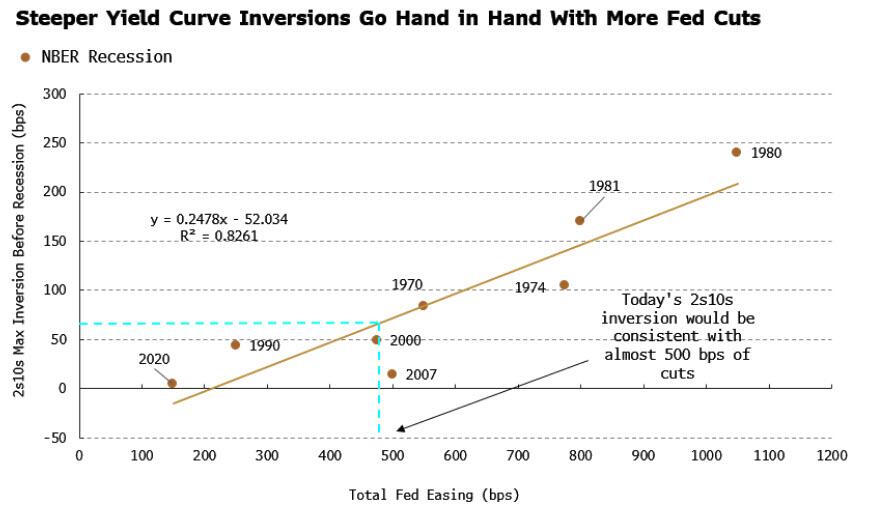
The current curve inversion is consistent with almost 500 bps of Fed cuts.
That’s not to say history will repeat itself exactly, but it gives a strong indication of the direction of travel.
The Fed currently foresees just over 100 bps of rate cuts from their expected peak by the end of 2024, according to the dot plot.
The market is increasingly at odds with this, with over 185 bps cuts priced in over the same period.
Given the historical record, put your money with the market in who’ll be proven more right.
Tyler Durden
Wed, 01/11/2023 – 14:45
fed
correlation
inflationary


Argentina Is One of the Most Regulated Countries in the World
In the coming days and weeks, we can expect further, far‐reaching reform proposals that will go through the Argentine congress.

Crypto, Crude, & Crap Stocks Rally As Yield Curve Steepens, Rate-Cut Hopes Soar
Crypto, Crude, & Crap Stocks Rally As Yield Curve Steepens, Rate-Cut Hopes Soar
A weird week of macro data – strong jobless claims but…

Fed Pivot: A Blend of Confidence and Folly
Fed Pivot: Charting a New Course in Economic Strategy Dec 22, 2023 Introduction In the dynamic world of economics, the Federal Reserve, the central bank…
