Economics
American Compass Dystopia: Americans’ “Stagnant” Income
Norbert Michel and Jai Kedia
A few weeks ago, American Compass released Rebuilding American Capitalism, A Handbook for Conservative Policymakers. This…

A few weeks ago, American Compass released Rebuilding American Capitalism, A Handbook for Conservative Policymakers. This Forbes column (American Compass Points To Myths Not Facts) provided a very brief critique of the handbook’s Financialization chapter, and Oren Cass, American Compass’s Executive Director, released a response titled Yes, Financialization Is Real.
This Cato at Liberty post is the fifth in a series that expands on the original criticisms. (The first four in the series are available here, here, here, and here.) This post discusses the one remaining core argument American Compass relies on – income stagnation. It demonstrates that the evidence contradicts American Compass’s income stagnation story.
The idea that Americans’ income has stagnated is central to American Compass’s argument that American capitalism needs to be rebuilt. The foreword in American Compass’s handbook uses this stagnation story as follows:
What has happened to capitalism in America? Businesses still pursue profit, yes, but not in ways that advance the public interest. Over the past 50 years, corporate profits rose by 185%. Wages rose by 1%. [Emphasis added.]
It connects this supposed stagnation to financial markets as follows:
Financialization shifted the economy’s center of gravity from Main Street to Wall Street, fueling an explosion in corporate profits alongside stagnating wages and declining investment. [Emphasis added.]
American Compass’s very reason for existence is to argue that American capitalism no longer flourishes largely because “globalization and financialization” are “undermining the nation’s prosperity.” The alleged evidence is that the typical American worker’s income has been stagnating for decades. The third sentence of Cass’s 2018 book, The Once and Future Worker, laments that “while gross domestic product (GDP) tripled from 1975 to 2015, the median worker’s wages have barely budged.”
This stagnation story, just as American Compass’s claims regarding talent, profit, and investment, does not hold up to scrutiny. The empirical evidence undercuts American Compass’s stated reason for existing. To be clear: It is true that America has many economic problems. In fact, Cato scholars regularly discuss countless ways to fix many of these problems. Unfortunately for American Compass, though, a broad stagnation (or decline) in Americans’ income is not a problem.
The opening lines of Cass’s book (reproduced above) provide an excellent starting point for this discussion. While it is very easy to verify something like GDP growth for any given period, it is not so straightforward to evaluate “the median worker’s wages” because the median worker can be defined in any number of ways. The term could reference, for example, someone who earns the median wage of all U.S. employees, the median wage of all private employees, or the median wage of all production and nonsupervisory employees (excluding managerial staff). Arguably, the term should exclude all part‐time workers or all workers under the age of 16. There simply is no single way to define the median (or typical) worker.
This basic problem is magnified by multiple definitions of income, including total compensation (wages plus fringe benefits, such as health insurance) and household income (both before and after taxes and transfers). Separately, for any given measure of income, adjusting for inflation with different price indices results in large disparities in real income growth over long periods of time. And, of course, choosing different time periods from within the overall length of a series can easily produce a deceptively low (or high) growth rate. These problems are all further complicated because the “typical” household from distant decades is no longer the typical American household – aside from multiple other demographic changes, more household income is now typically spread over fewer family members.
It is straightforward to use Cass’s example to illustrate some of these points. For instance, using the Consumer Price Index (CPI) to adjust average hourly earnings of production and nonsupervisory employees suggests that real wages have grown less than 1 percent from 1975 to 2015, consistent with Cass’s statement. However, adjusting the same earnings data with the Personal Consumption Expenditures (PCE) index indicates that real wages grew 22 percent – obviously not stagnant.
Interestingly, using either a longer or shorter timeframe provides a very different growth figure than Cass’s 1975 to 2015 period. For example, examining the same income series from 1964 – the first year the data is available from the Bureau of Labor Statistics (BLS) – to 2015, while adjusting for inflation with the CPI, shows that real wages grew almost 9 percent from 1964 to 2015. Using the PCE shows that real wages grew a bit more than 39 percent from 1964 to 2015. Separately, using the CPI to examine the same income series from 1991 to 2015 (both 1975 and 1991 mark the end of a recession) shows that income grew almost 15 percent. Using the PCE to adjust for inflation suggests that income grew 27 percent for this period.
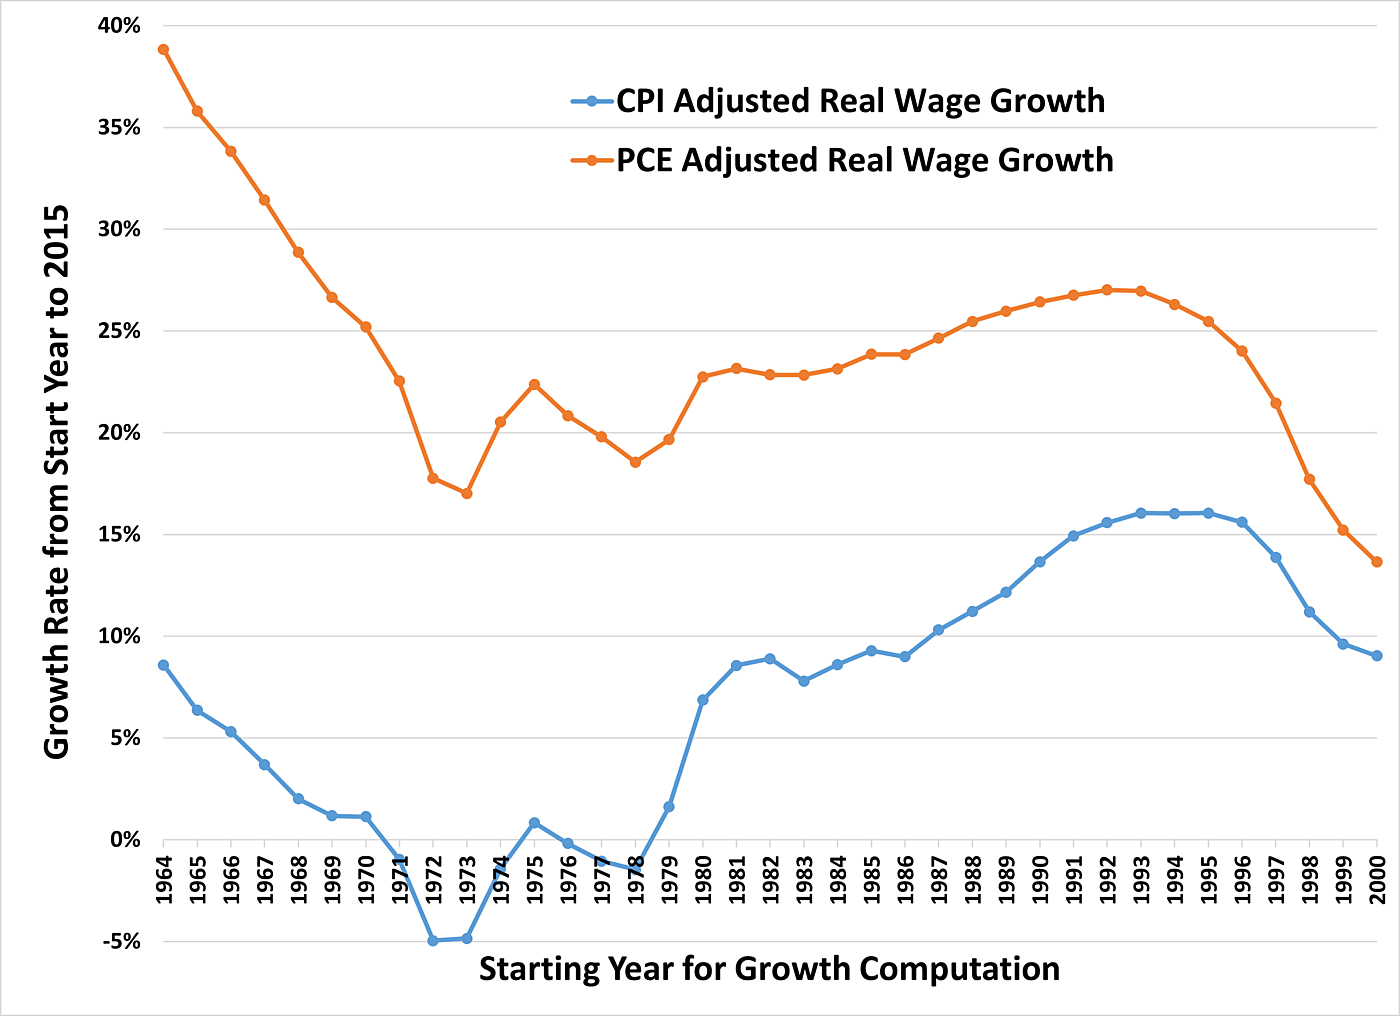
As Figure 1 demonstrates, “income growth” is highly influenced by the chosen inflation metric and the starting point for the period of analysis. Figure 1 plots the growth rate in real income – average hourly earnings of production and nonsupervisory employees – with the rate calculated using every year from 1964 to 2000, respectively, as the starting point, and 2015 as the ending year. It shows the analysis using both the CPI and PCE to convert nominal wages to real. (Real adjustments made using the PCE, the Fed’s preferred price measure, always result in a higher growth rate.) Using 1975 as the starting point for this analysis, for CPI adjusted income, produces the lowest possible (positive) growth rate.
Using only this method – the one Cass uses – while ignoring all the others gives the false impression that real income was stagnant.
Similar issues arise using the Census Bureau’s household income figures, but even the basic data, as reported, contradicts the stagnation story. For instance, without making any adjustments for changes in demographics, Census reports that real median household income increased 34.18 percent from 1967 to 2018.[1] That’s hardly stagnant.
Still, because the number of people in each household declined 23 percent from 1967 to 2018 (from 3.3 individuals to an all‐time low of 2.53),[2] the Census income distribution figures understate how well individuals have been doing. Larger household incomes are now divided among fewer people, so adjusting for only this change in household size shows that real median household income increased 74 percent, from $14,355 in 1967 to $24,972 in 2018.[3] That’s more than double the increase shown in the unadjusted data, far from stagnant.
While many journalists have let go of the income stagnation story, others have (even if unintentionally) fueled the false narrative. Take, for instance, an article in The Atlantic that discussed the U.S. Census Bureau’s 2018 report Income and Poverty in the United States. The author noted:
Around 13 percent of households made more than $150,000 last year; a decade ago, by comparison, 8.5 percent did. While that’s something to cheer, without a solid middle class, it’s not indicative of an economy that is healthy and stable more broadly.
At best, the author is guilty of a major understatement.
The 2018 Census report shows that more than 5 million households – not individuals, but families – moved into the high‐earning category. That shift is undoubtedly something to cheer, but the author still implies that these numbers support a “disappearing middle class” narrative. As Mark Perry from the American Enterprise Institute confirms, the very same Census report shows that the share of households earning between $35,000 and $100,000 fell from more than 53 percent in 1967 to 42 percent in 2018, and that the share of households earning more than $100,000 essentially tripled, from less than 10 percent in 1967 to more than 30 percent in 2018. Moreover, while The Atlantic article largely ignores it, the share of households earning less than $35,000 fell, from approximately 36 percent in 1967 to less than 28 percent in 2018.
Together, these statistics show a broad increase in prosperity. In fact, this increase is even more impressive considering that the number of American households essentially doubled from 1970 to 2018. For anyone interested in additional evidence that typical Americans – and even, in many cases, lower income Americans – have been earning higher and higher incomes during the last several decades, here are a few references:
- William Cline, U.S. Median Household Income Has Risen More Than You Think
- Richard V. Burkhauser, Jeff Larrimore, and Kosali I. Simon, A “Second Opinion” On The Economic Health Of The American Middle Class
- Salim Furth, Stagnant Wages: What the Data Show
- Michael Strain, The Myth of Income Stagnation
- Scott Winship, Stagnationists Are Simply Wrong and What You Need to Know from the New CBO Income Figures
- Gerald Auten and David Splinter, Income Inequality in the United States: Using Tax Data to Measure Long‐Term Trends
- Thomas Hirschl and Mark Rank, The Life Course Dynamics of Affluence
- Scott Lincicome, The American Wealth Machine and Its Misguided Discontents and The Annoying Persistence of the Income Stagnation Myth
- John Early, The Myth of American Income Inequality
In 2020, perhaps after recognizing that the basic income stagnation story does not hold up, American Compass began releasing its Cost‐of‐Thriving Index (COTI) to provide “a better way to understand the challenge for working families.” According to Cass, his COTI is better than looking at inflation‐adjusted (real) income:
Economists rely on inflation‐based adjustments to compare costs of living over time, but this method measures the cost of buying the same set of things in different eras. Perhaps a family could more easily afford a 1985 quality of life in 2015 than in 1985, but being in the middle class in 2015 means affording a 2015 quality of life.
While it is true that price indices are imperfect, and they tend to make older incomes look larger than they really were, Cass’s description of inflation‐based adjustments over time is highly flawed. Adjusting nominal income to “real” income essentially converts the dollar amount to a quantity, such that it indicates how much “stuff” someone can buy. And both the CPI and the PCE account for (as best as possible) the different quality of goods and services available to people over time, as well how people may buy different products (substitute), including those that they were previously unable to purchase.
Setting this flaw aside, American Compass uses its COTI to argue that living standards have declined, supposedly explaining why “America’s working families” are correct to “feel that they have come under increasing economic pressure.” However, as the American Enterprise Institute’s Scott Winship and Jeremy Horpedahl have documented, American Compass’s COTI methodology is just as flawed as its understanding of inflation‐based adjustments.
In their new paper, Winship and Horpedahl demonstrate that the American Compass COTI decline is the direct result of its design choices. Specifically, American Compass’s COTI ignores taxes and transfers (which tend to boost lower earners’ incomes), excludes full‐time workers younger than 25 years old, and excludes full‐time female workers. American Compass’s COTI also includes a very narrow range of goods and services, defining food, transportation, housing, health care, and higher education as “needs,” yet leaving purchases of clothing, home furnishings, utilities, and communications technology out of the COTI.
American Compass’s COTI methodology is consistent with its propensity for selectively choosing data to give the appearance of supporting evidence for its claims. Thus, Winship and Horpedahl reach a reasonable conclusion regarding American Compass’s COTI report:
Against these data, Cass asks us to believe that, in truth, living standards are down by 36 percent. We have shown that this claim bears no relationship to reality.
…
While Cass’s claims are out of line with all plausible estimates by serious researchers, they align neatly with his organization’s view that American capitalism requires “rebuilding.”
It is also worth mentioning that American Compass’s COTI conflicts with other research that uses separate alternative measures of well‐being that do not depend on inflation‐adjusted income metrics. For instance, Bruce Sacerdote’s 2017 National Bureau of Economic Research (NBER) paper reports that consumption for two‐person households with below median income increased as much as 164 percent from 1960 to 2015. The paper points out that spending on food and clothing grew slower than the growth in total consumption during this period, and that this falling share of total consumption for food and clothing is consistent with real income growth being higher than income‐based measures suggest.
Another consumption‐based measure of well‐being is the number of work hours needed to purchase the same goods at two different points in time. Researchers can use this metric to gauge whether, for example, real income stagnated from 1975 to 2015. If the amount of time someone would need to work to buy the same bundle of consumer goods in 1975 is no different than it is in 2015, then real income has stagnated. On the other hand, if the required work time to purchase the same bundle has fallen, then the evidence suggests that real income has increased. Using a sample of 400 consumer products, George Mason’s Don Boudreaux reports that only one good–men’s work boots–costs more in work time in 2019 than in 1975. (In Myths Of Rich And Poor: Why We’re Better Off Than We Think, Michael Cox and Richard Alm use the same method and report similar results.)
The Simon Project, an endeavor of the Cato Institute’s HumanProgress.org, formalizes these ideas by creating an index based on the time price (how long someone must work to acquire a good) of 50 basic commodities. Their index shows that the average time price of these 50 commodities fell more than 72 percent between 1980 and 2018. In practical terms, this figure means that if it took one hour of work to buy a commodity – such as sugar, coffee, pork, or lumber – in 1980, it took only about 17 minutes of work to buy that same commodity in 2018. Put differently, if it took one hour of work to buy an item in 1980, that same hour of work would buy almost four units of the same good in 2018.
This Cato post has demonstrated that American Compass’s bleak income stagnation story is a false narrative. American Compass selectively chooses its preferred time periods and economic measures so it appears as if the evidence supports its story. Moreover, as previous posts in this series established, American Compass displays this same propensity to selectively pick terms and dates that appear to support its “financialization” narrative. In all these cases, though, the evidence contradicts American Compass’s claims.
[1] Authors’ calculations using the following U.S. Census income and household size data: Table A‑2. Households by Total Money Income, Race, and Hispanic Origin of Householder: 1967 to 2018, https://www.census.gov/library/publications/2019/demo/p60-266.html, and Table HH‑4. Households by Size: 1960 to Present, https://www.census.gov/data/tables/time-series/demo/families/households….
[2] Mark Perry, “More Charts And Commentary Based On This Week’s Census Bureau Report On Income,” American Enterprise Institute, September 12, 2019, https://www.aei.org/publication/more-charts-and-commentary-based-on-this-weeks-census-bureau-report-on-income/.
[3] Author’s calculations using the following U.S. Census income and household size data: Table A‑2. Households by Total Money Income, Race, and Hispanic Origin of Householder: 1967 to 2018, https://www.census.gov/library/publications/2019/demo/p60-266.html, and Table HH‑4. Households by Size: 1960 to Present, https://www.census.gov/data/tables/time-series/demo/families/households….
dollar
inflation
commodities
commodity
markets
fed
stagnation


Argentina Is One of the Most Regulated Countries in the World
In the coming days and weeks, we can expect further, far‐reaching reform proposals that will go through the Argentine congress.

Crypto, Crude, & Crap Stocks Rally As Yield Curve Steepens, Rate-Cut Hopes Soar
Crypto, Crude, & Crap Stocks Rally As Yield Curve Steepens, Rate-Cut Hopes Soar
A weird week of macro data – strong jobless claims but…

Fed Pivot: A Blend of Confidence and Folly
Fed Pivot: Charting a New Course in Economic Strategy Dec 22, 2023 Introduction In the dynamic world of economics, the Federal Reserve, the central bank…
