Economics
A Partial Recovery For Global Markets Last Week
Global markets posted a mixed run in last week’s trading, but the general trend continues to skew negative, based on a set of proxy ETFs through Friday’s…

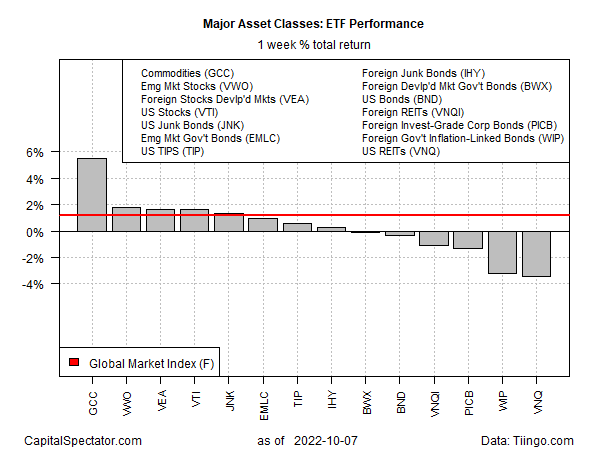
Global markets posted a mixed run in last week’s trading, but the general trend continues to skew negative, based on a set of proxy ETFs through Friday’s close (Oct. 7).
A broad measure commodities was the big winner for the major asset classes. WisdomTree Commodity (GCC) popped a hefty 5.5% last week, the ETF’s first weekly gain in a month. But the rebound doesn’t change the technical bias, which still skews negative.

A headwind for sentiment in the commodities space is a renewed focus on China’s slowing economy, the world’s second-largest consumer of crude oil after the US. “Oil … is getting hit with the triple whammy of China’s economic weakness, US monetary policy tightening and Biden administration SPR intervention,” advises Stephen Innes, managing director at SPI Asset Management, in a research note.
US stocks (VTI) participated in last week’s rally, but a broad measure of US bonds (BND) continued falling.
Last week’s biggest loser: US real estate investment trusts via Vanguard Real Estate (VNQ), which closed down 3.4%, the fourth straight weekly loss.
Market action was a net positive last week for the Global Market Index (GMI.F), an unmanaged benchmark, maintained by CapitalSpectator.com. This index holds all the major asset classes (except cash) in market-value weights via ETFs and represents a competitive measure for multi-asset-class portfolio strategies overall. GMI.F rose 1.2%, the benchmark’s first weekly gain in the past four.
For the one-year window, commodities continue to hold on to the only gain for this time window among the major asset classes. GCC closed up 8.0% on Friday vs. the year-earlier price.
The rest of the major asset classes are still in the red for one-year results. Foreign corporate bonds (PICB) continue to post the deepest one-year loss: a steep 31.5% decline.
GMI.F is down 20.0% for the past year.

Using a drawdown lens to profile the major asset classes continues to show a range of steep peak-to-trough declines. Inflation-indexed US government bonds (TIP) are still posting the softest drawdown: -13.8%. The steepest is currently in foreign corporate bonds (PICB) via a 35.7% drawdown.
GMI.F’s drawdown: nearly -24% (green line in chart below).

How is recession risk evolving? Monitor the outlook with a subscription to:
The US Business Cycle Risk Report
inflation
commodities
commodity
monetary
markets
policy
monetary policy


Argentina Is One of the Most Regulated Countries in the World
In the coming days and weeks, we can expect further, far‐reaching reform proposals that will go through the Argentine congress.

Crypto, Crude, & Crap Stocks Rally As Yield Curve Steepens, Rate-Cut Hopes Soar
Crypto, Crude, & Crap Stocks Rally As Yield Curve Steepens, Rate-Cut Hopes Soar
A weird week of macro data – strong jobless claims but…

Fed Pivot: A Blend of Confidence and Folly
Fed Pivot: Charting a New Course in Economic Strategy Dec 22, 2023 Introduction In the dynamic world of economics, the Federal Reserve, the central bank…
